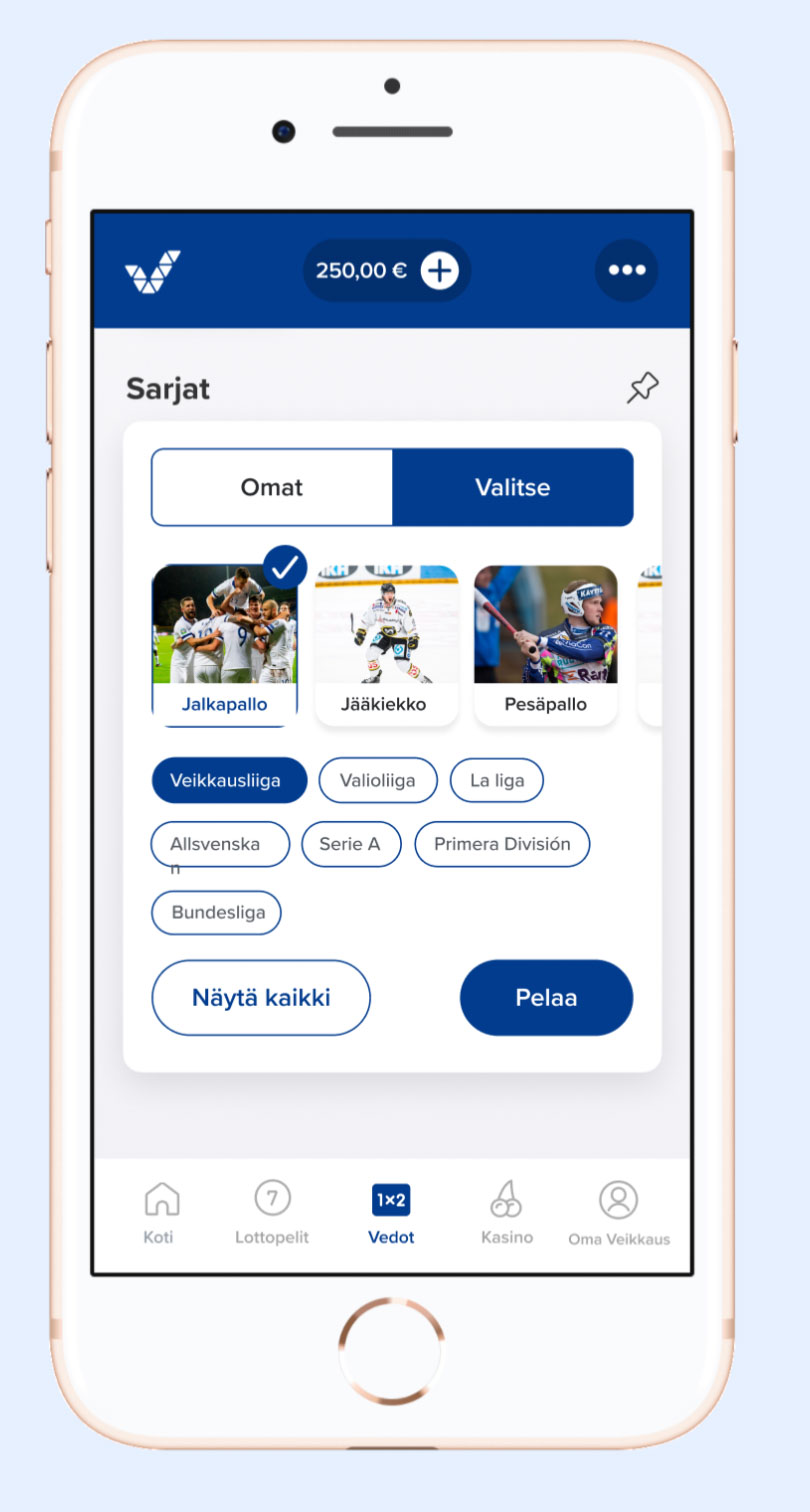
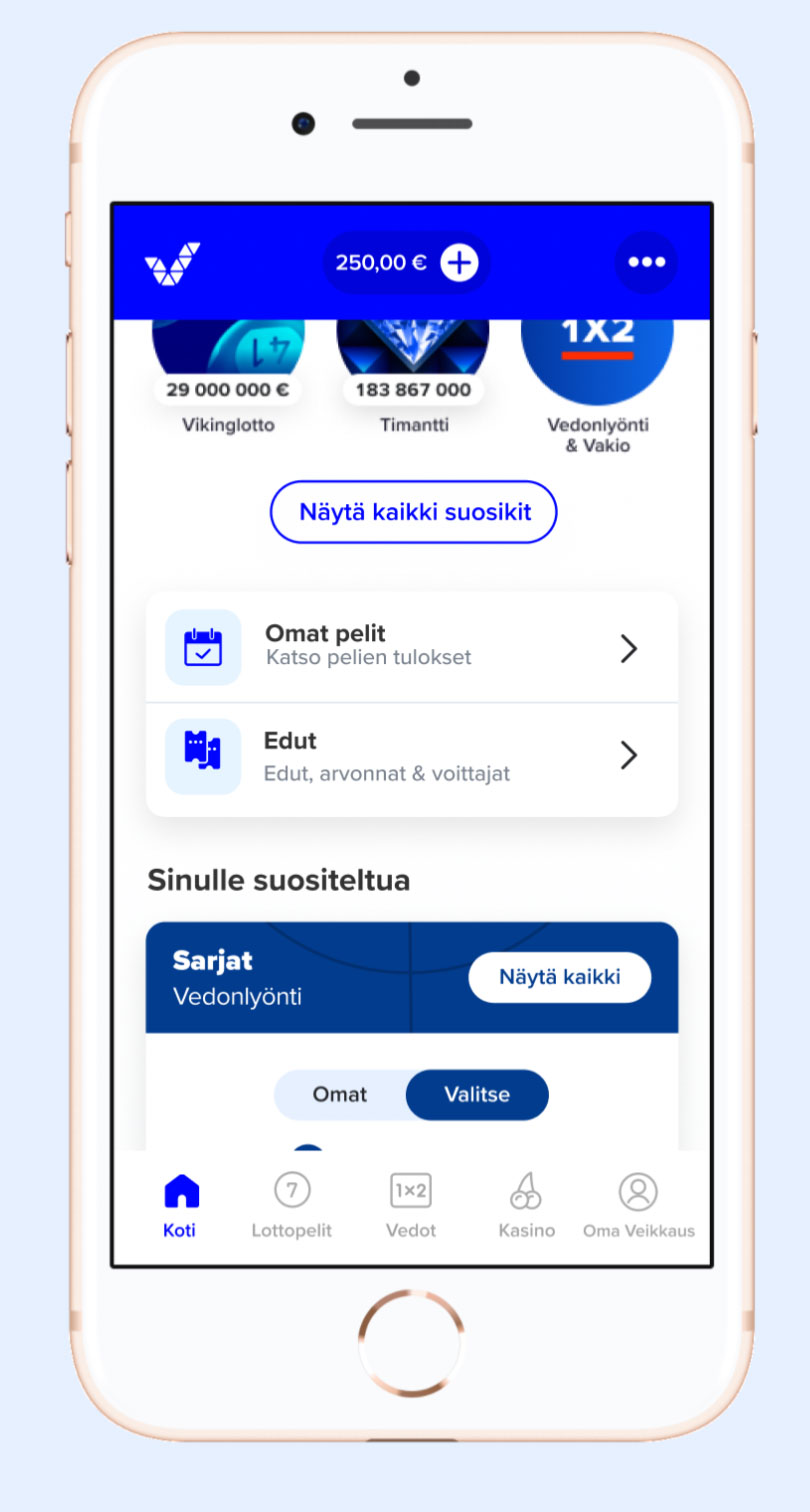
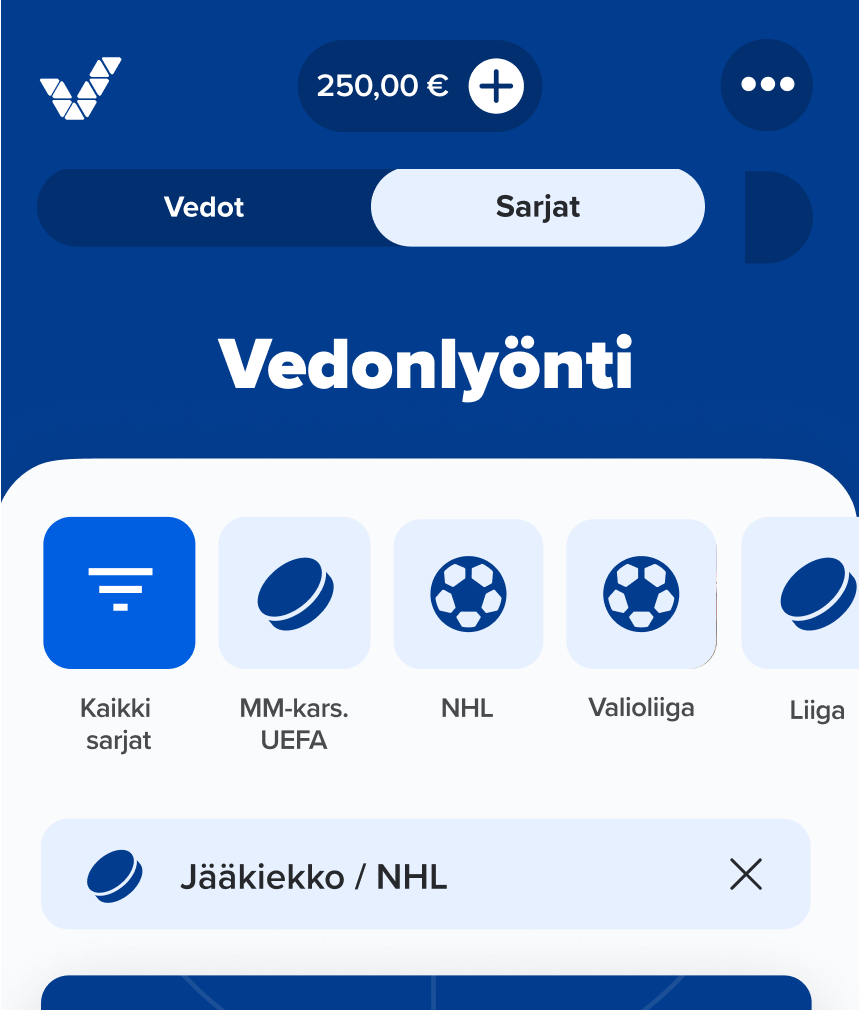
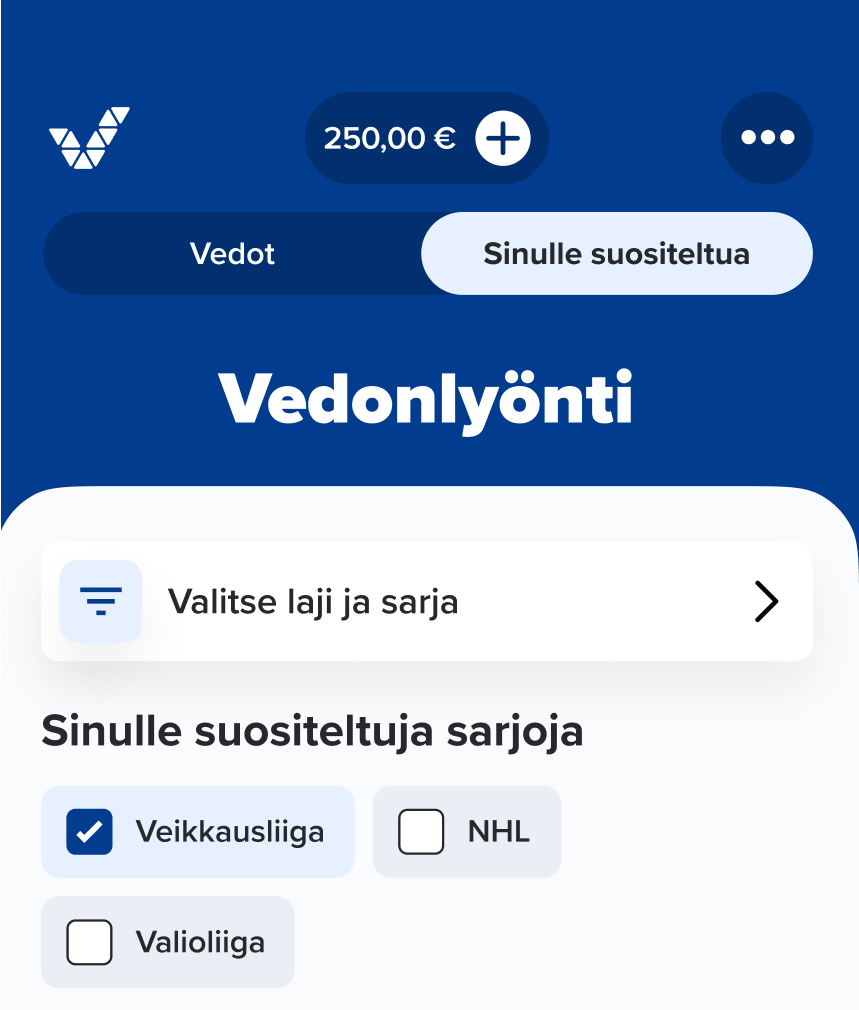
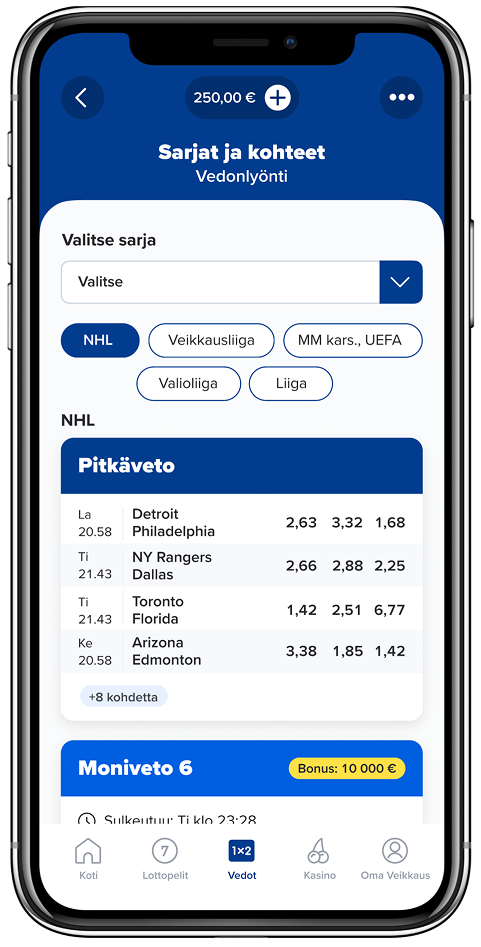
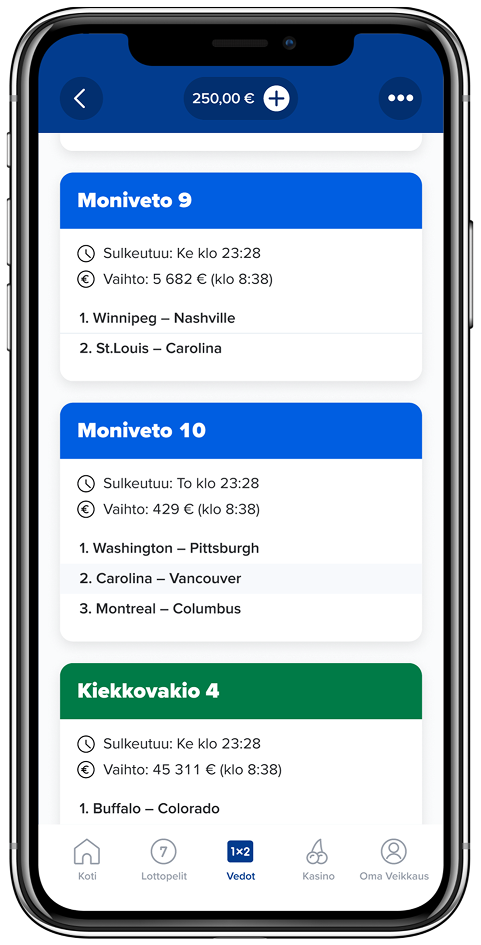
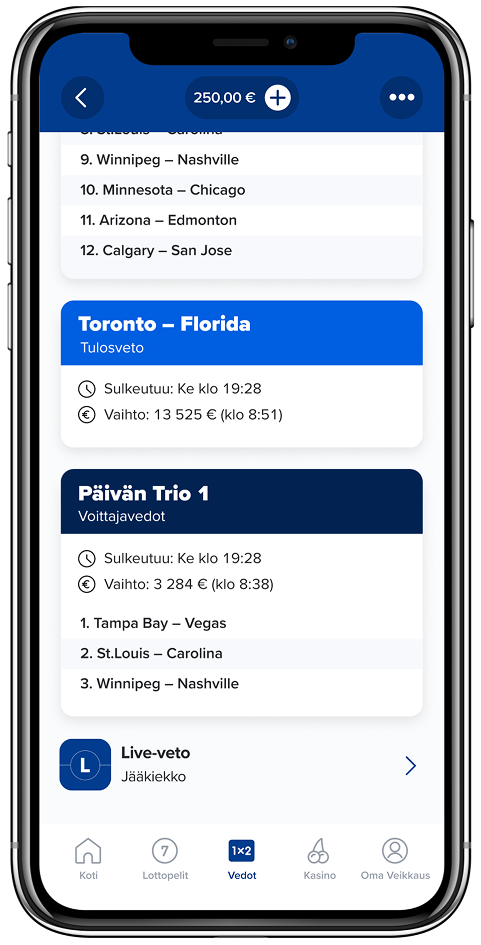
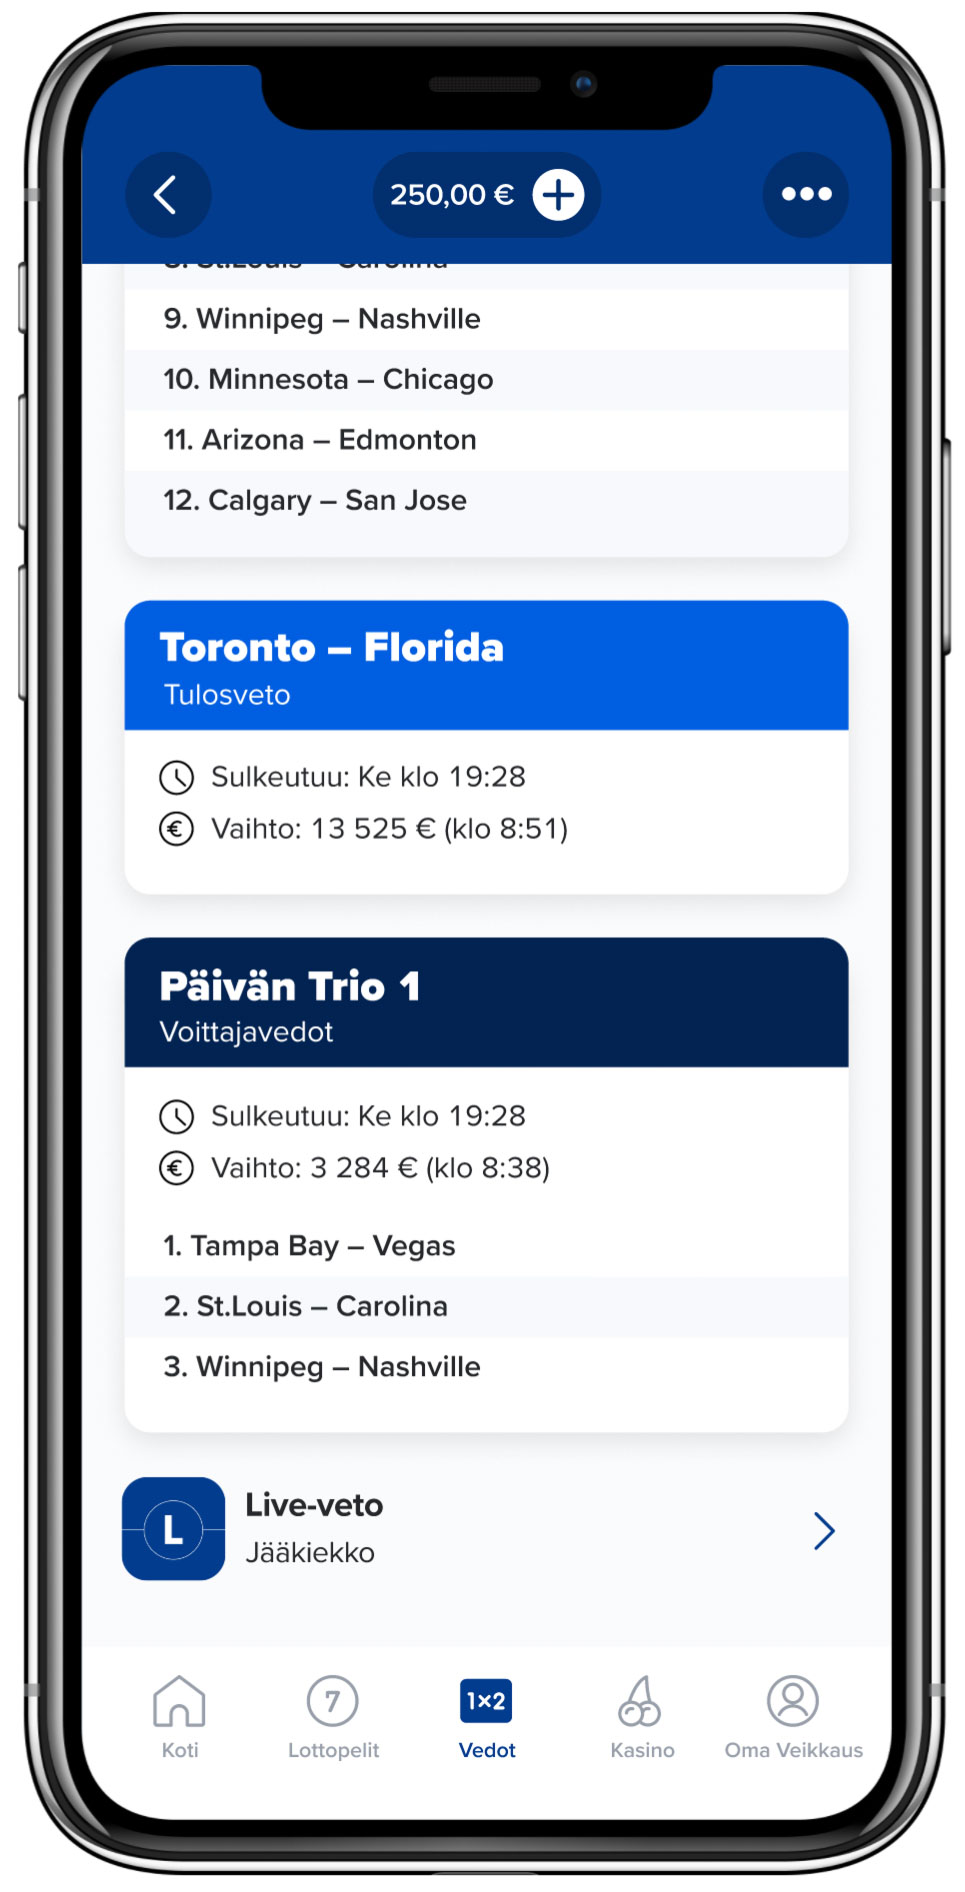
We created new ways for customers to find items. In the work, I led a mobile-first design and validation of the Leagues view.
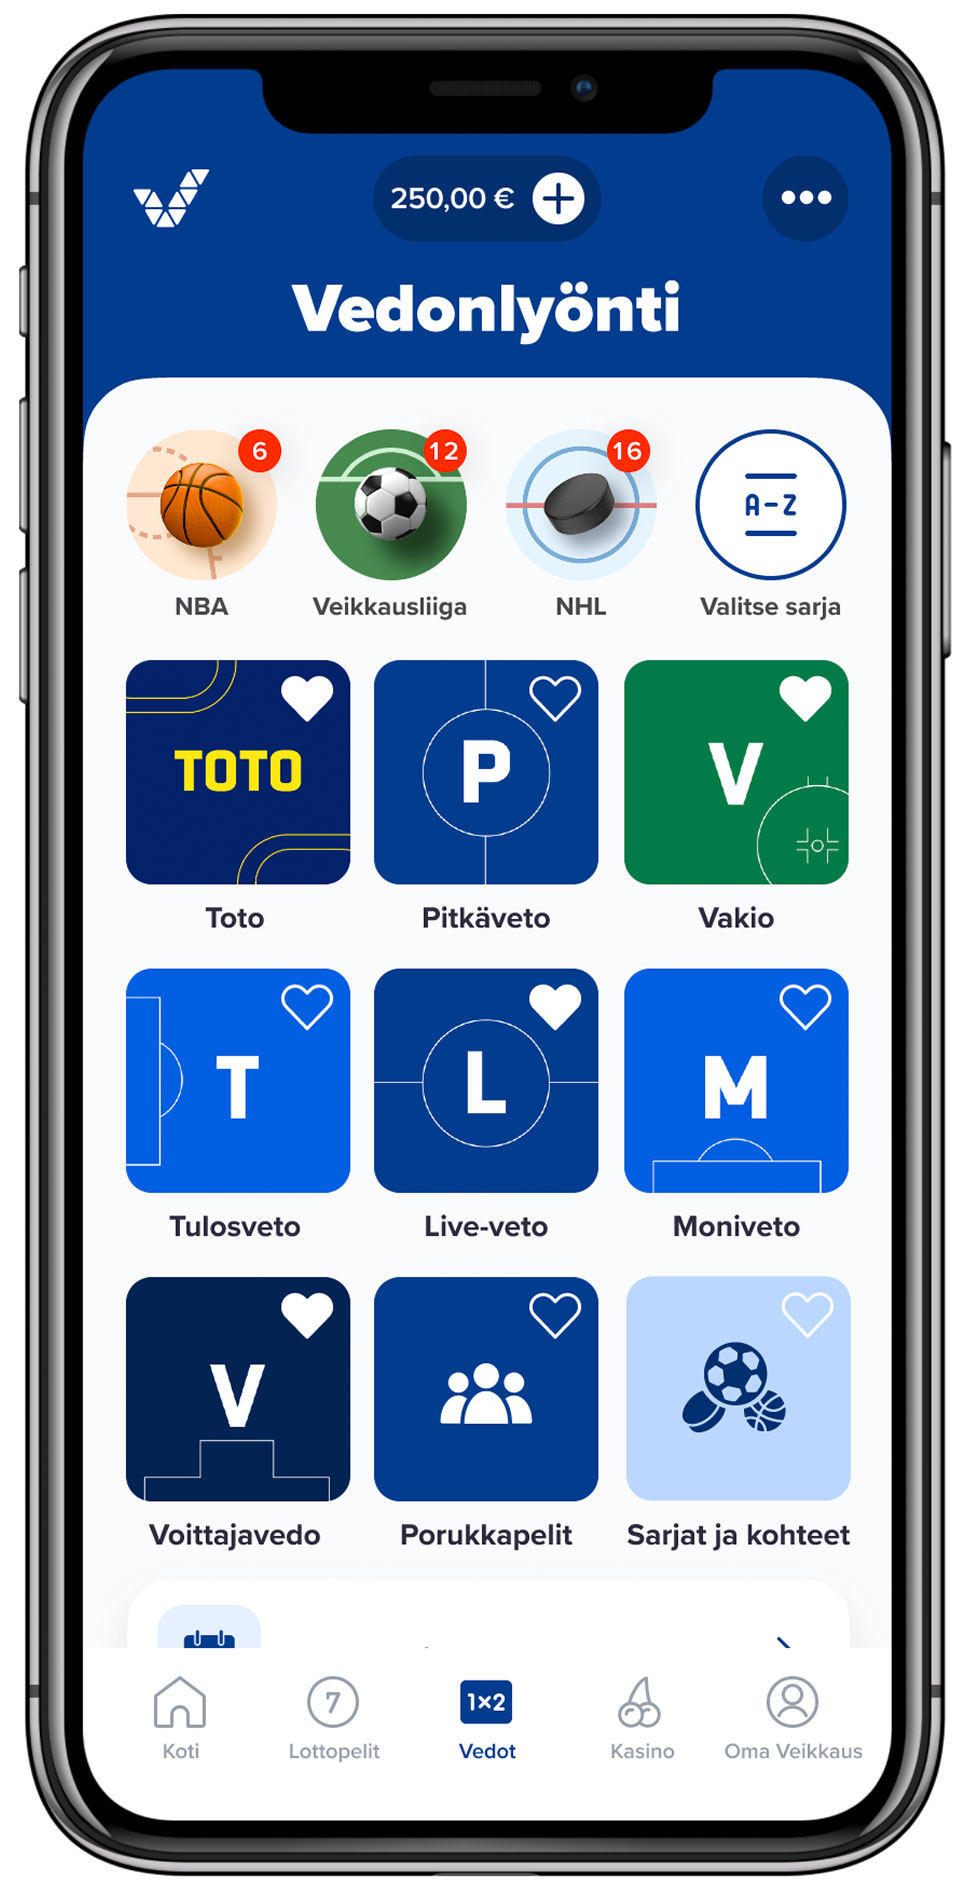
Discovery & proto
Design refinement
AB testing
#3
As a result, Leagues view became the 3rd most visited betting view. On the business side, it drove products per customer (+2%) and sales conversion (+3%).
#3
User story
Janne, a betting PO, gave us this story. I illustrated it.


Could we bring bets from other betting products into Mikko’s customer journey?
From a business point of view, would that make sense?
Discovery & proto
Problem
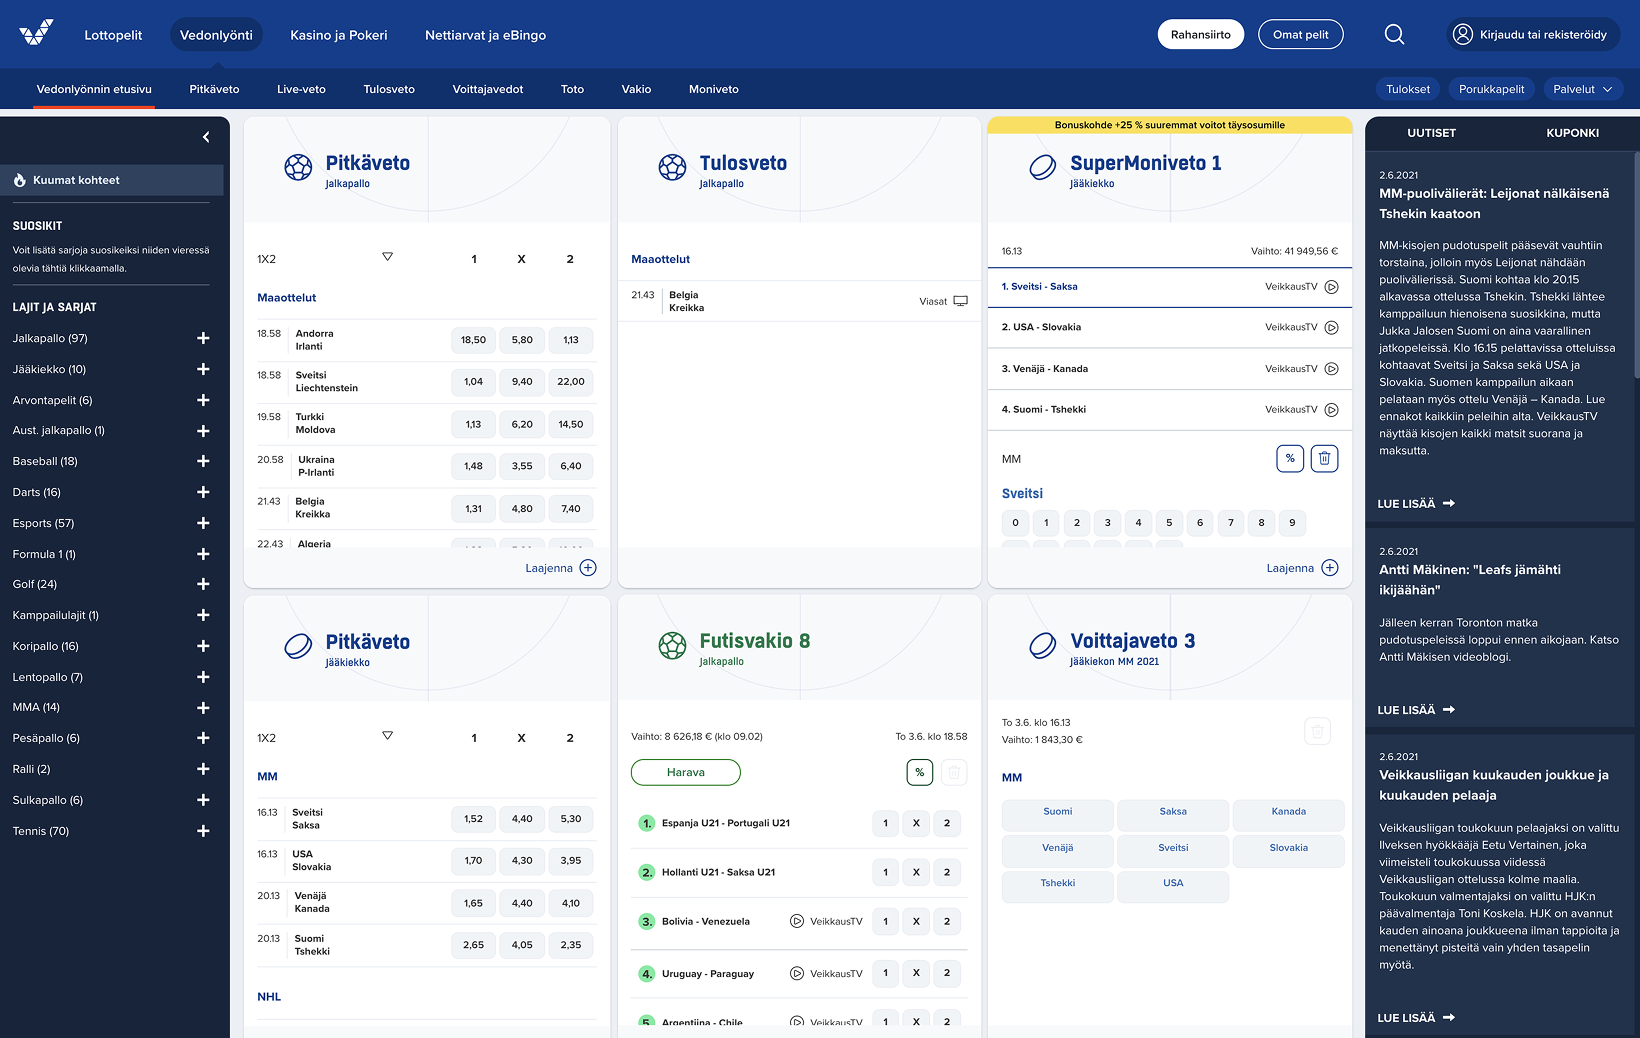
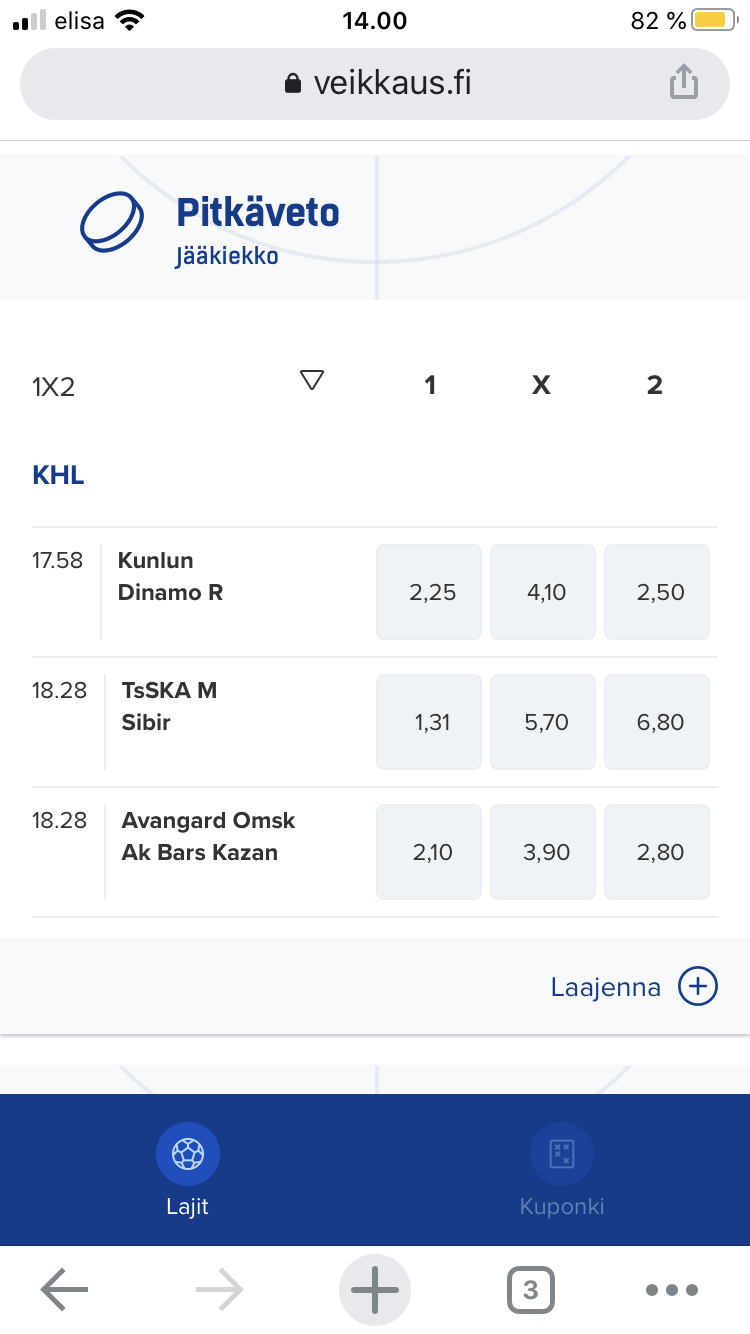
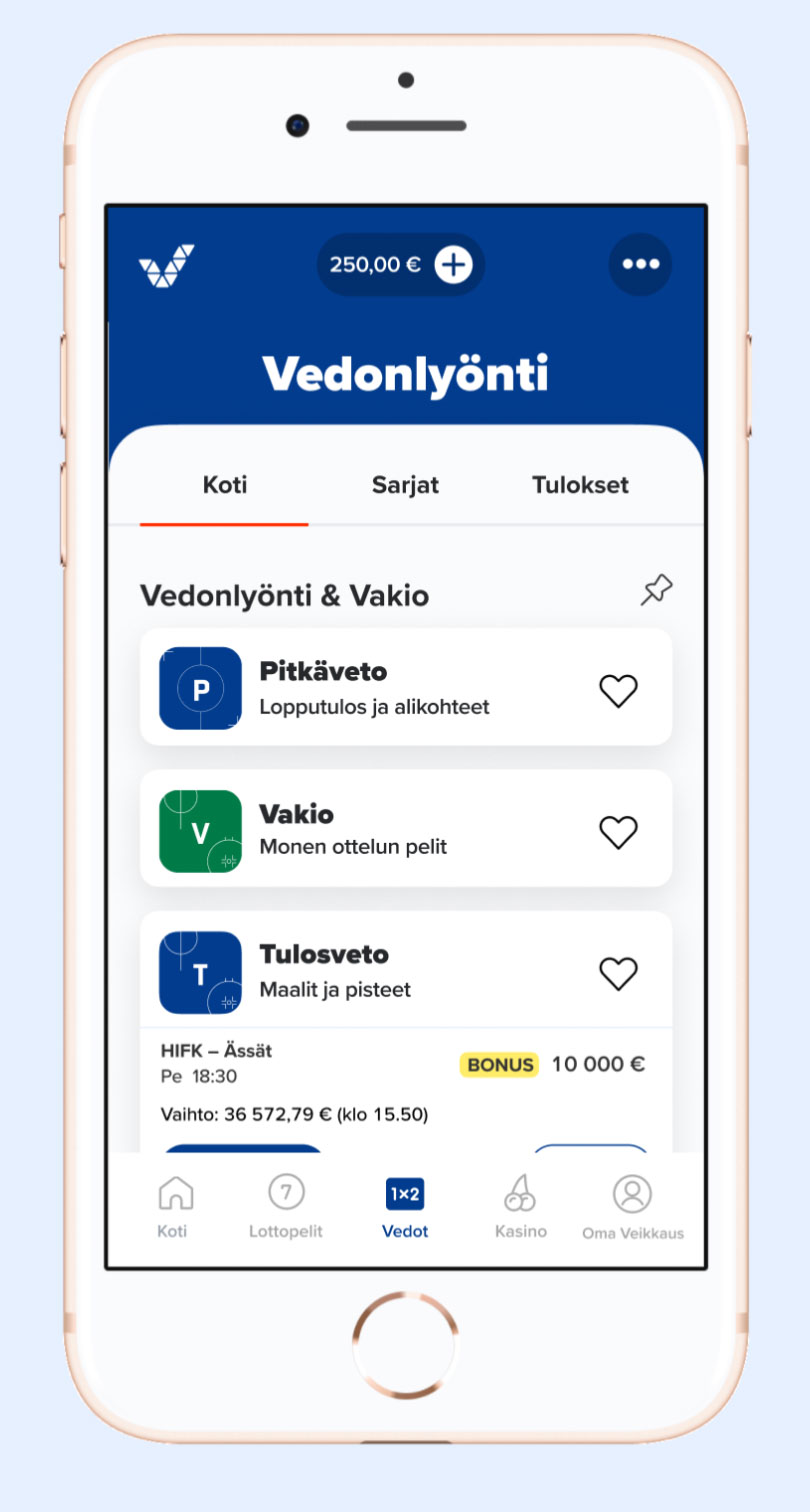
A major project had designed a suboptimal shared view for six game products. Unfortunately, the earlier design was desktop-first, and it looked complicated.
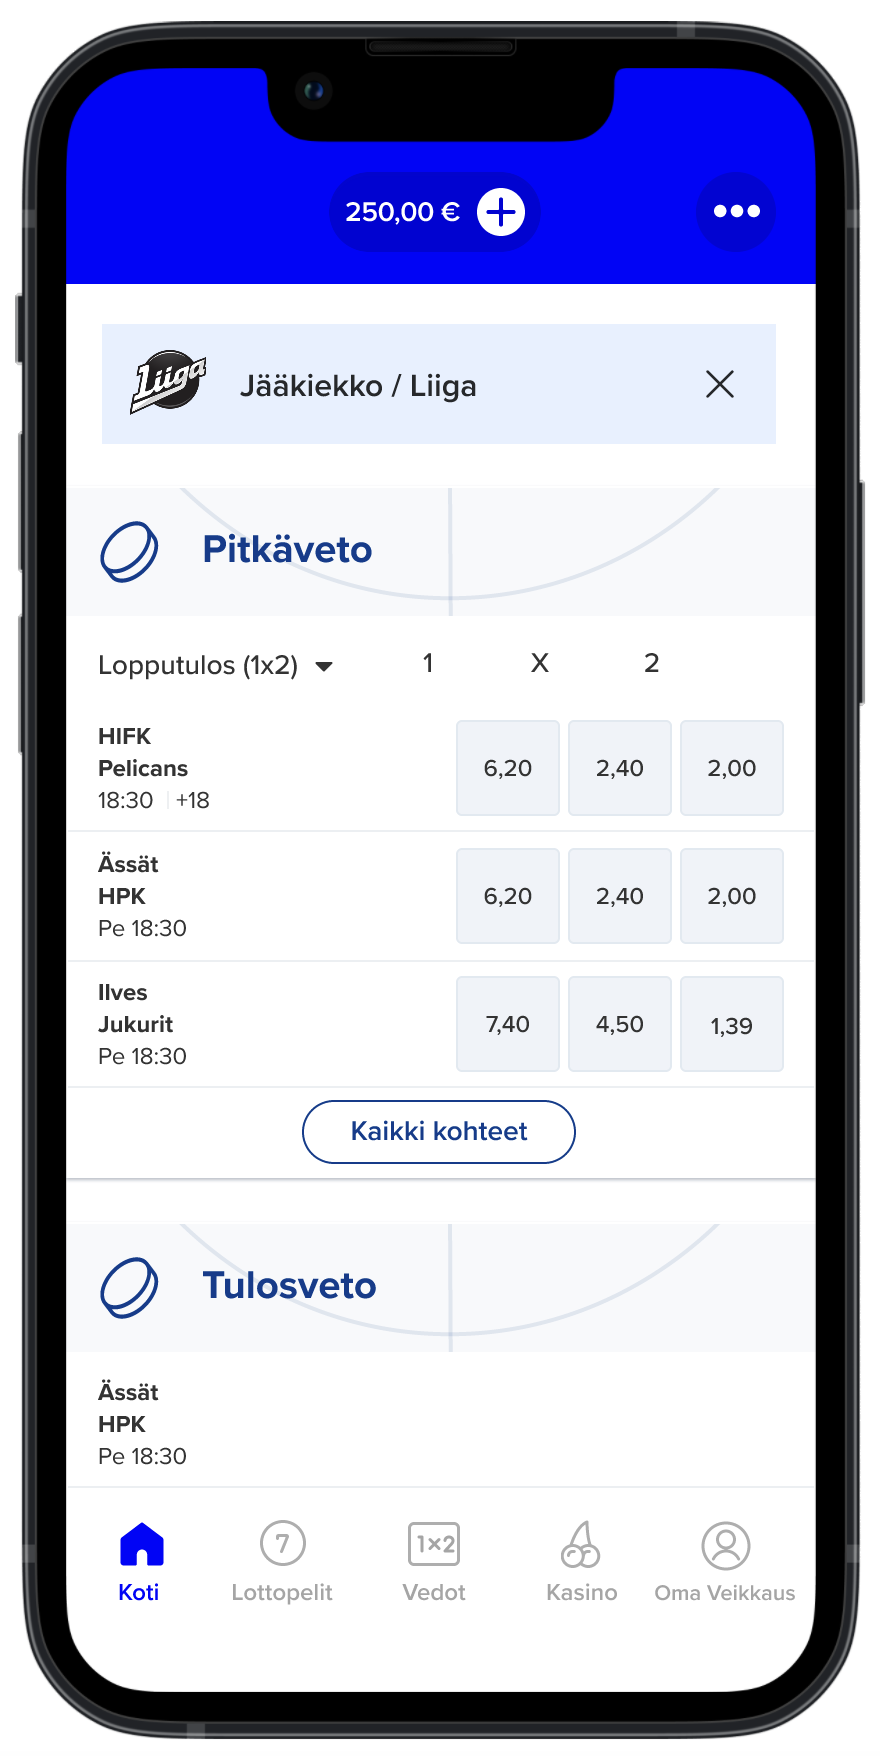
On mobile, the screen didn’t feel inviting. Do the layouts below invite you to explore and scroll?
Concept
Workshop
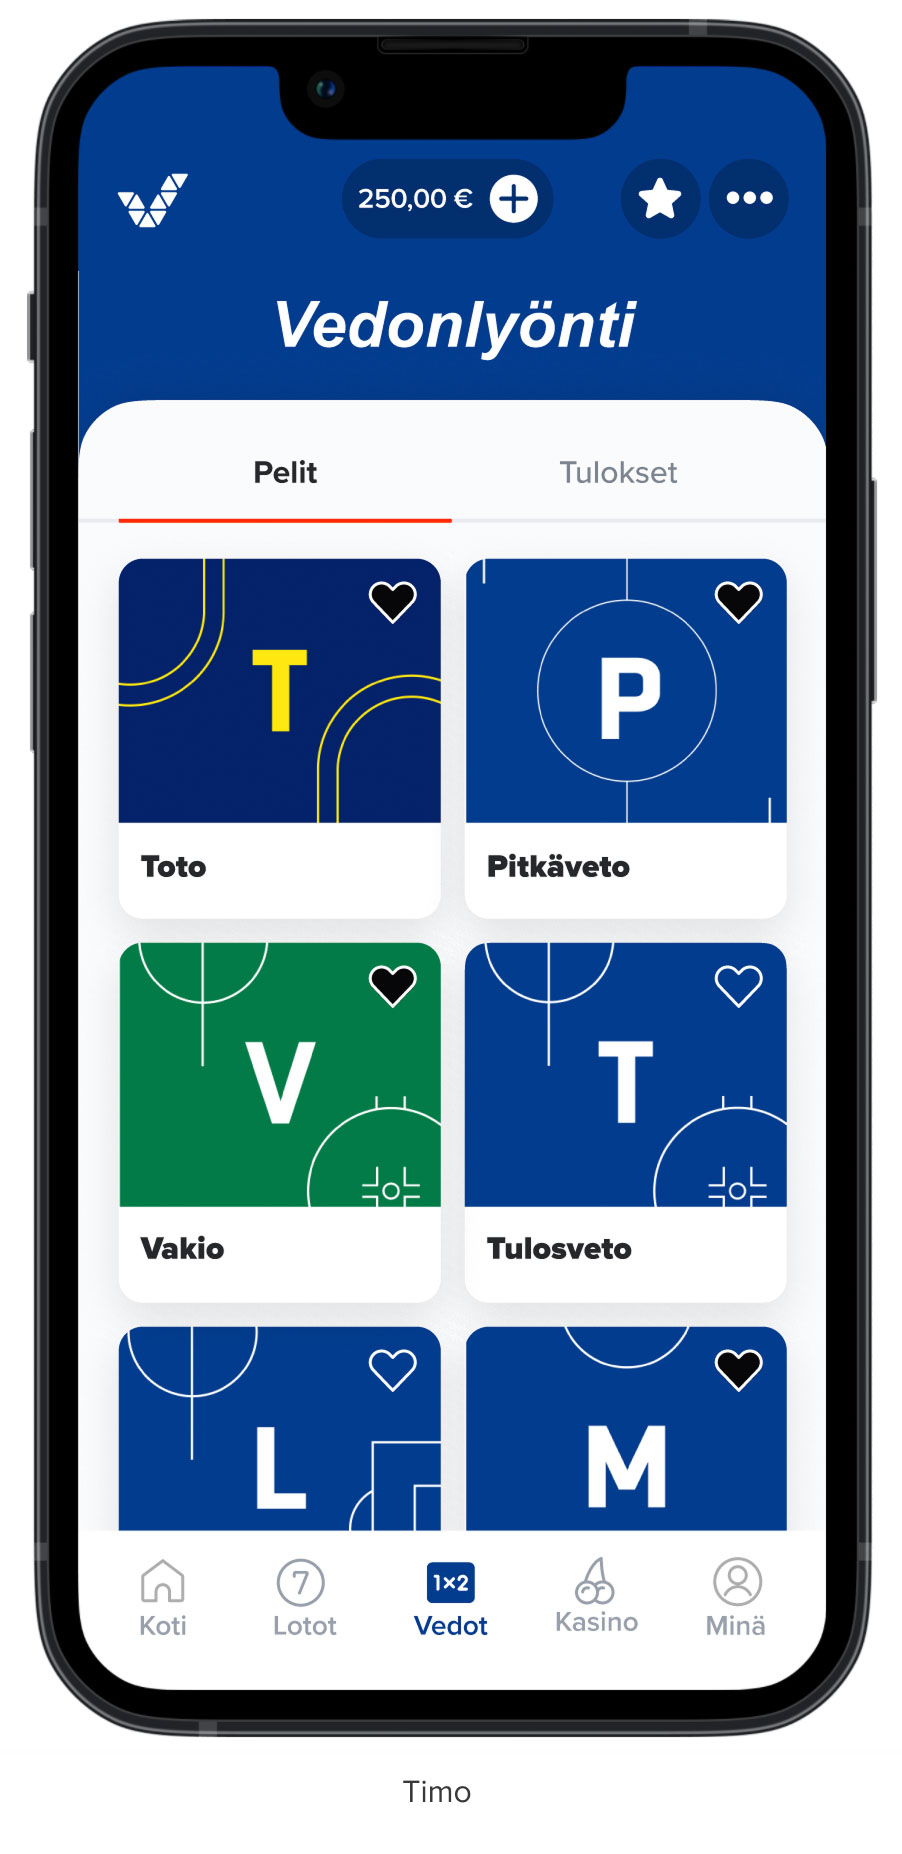
I facilitated a brainstorming with 10+ designers. My colleague Timo helped me master the method with his creative design background.
In the workshop, many had great ideas (examples above). Still, we needed some detours because the ideas lacked interaction designs and technical building blocks.
Interactive proto
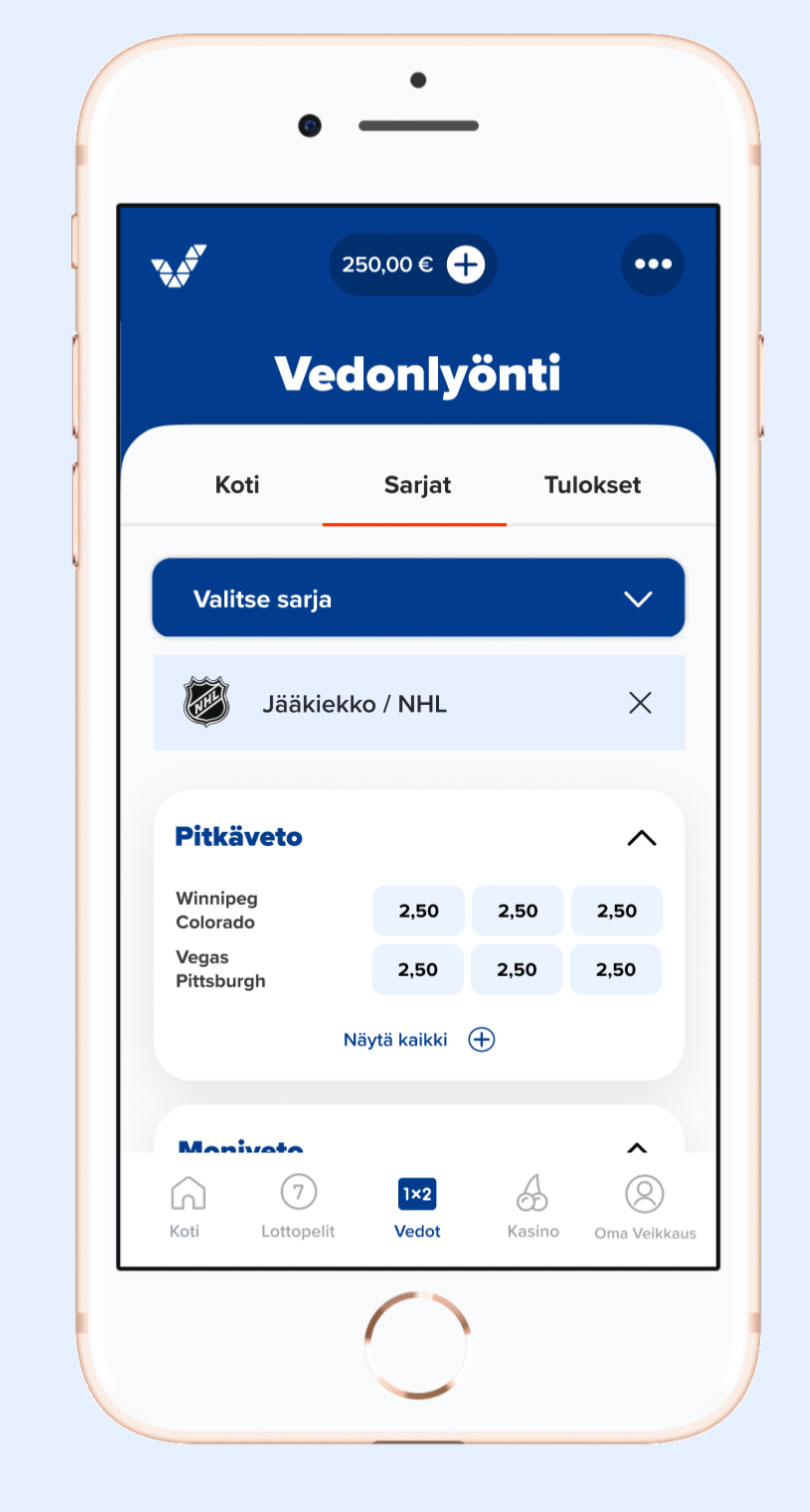
I combined the ideas into a user flow, and made a prototype of it. The proto built on my leagues view concept (second layout below).
User testing
We tested with five participants in a moderated lab test. They tried out the Leagues proto and the desktop-first production UI. The participants also showed their own playing – a practice I promote. Our UX researcher Luke ran the tests.
I visualized the test in an single canvas view (screenshot above). I updated the canvas as we went from planning to sharing results.
Test participants used the Leagues view successfully. We saw how they chose betting targets by sport leagues. As expected, our proto matched how they thought about betting. They found the Leagues view intuitive. Main critique was that Champions League was missing in the proto.
Design refinement
Co-design
What should we show in the leagues view in its empty state, when a customer lands there? I identified the need for a new personalization model, and consulted our Data Scientist Jarno. He said he’ll build one.
I organized an ideation workshop, where two cross-functional teams sketched out designs. Each team had a designer, a data scientist, and a betting product specialist.
Workshop outcome
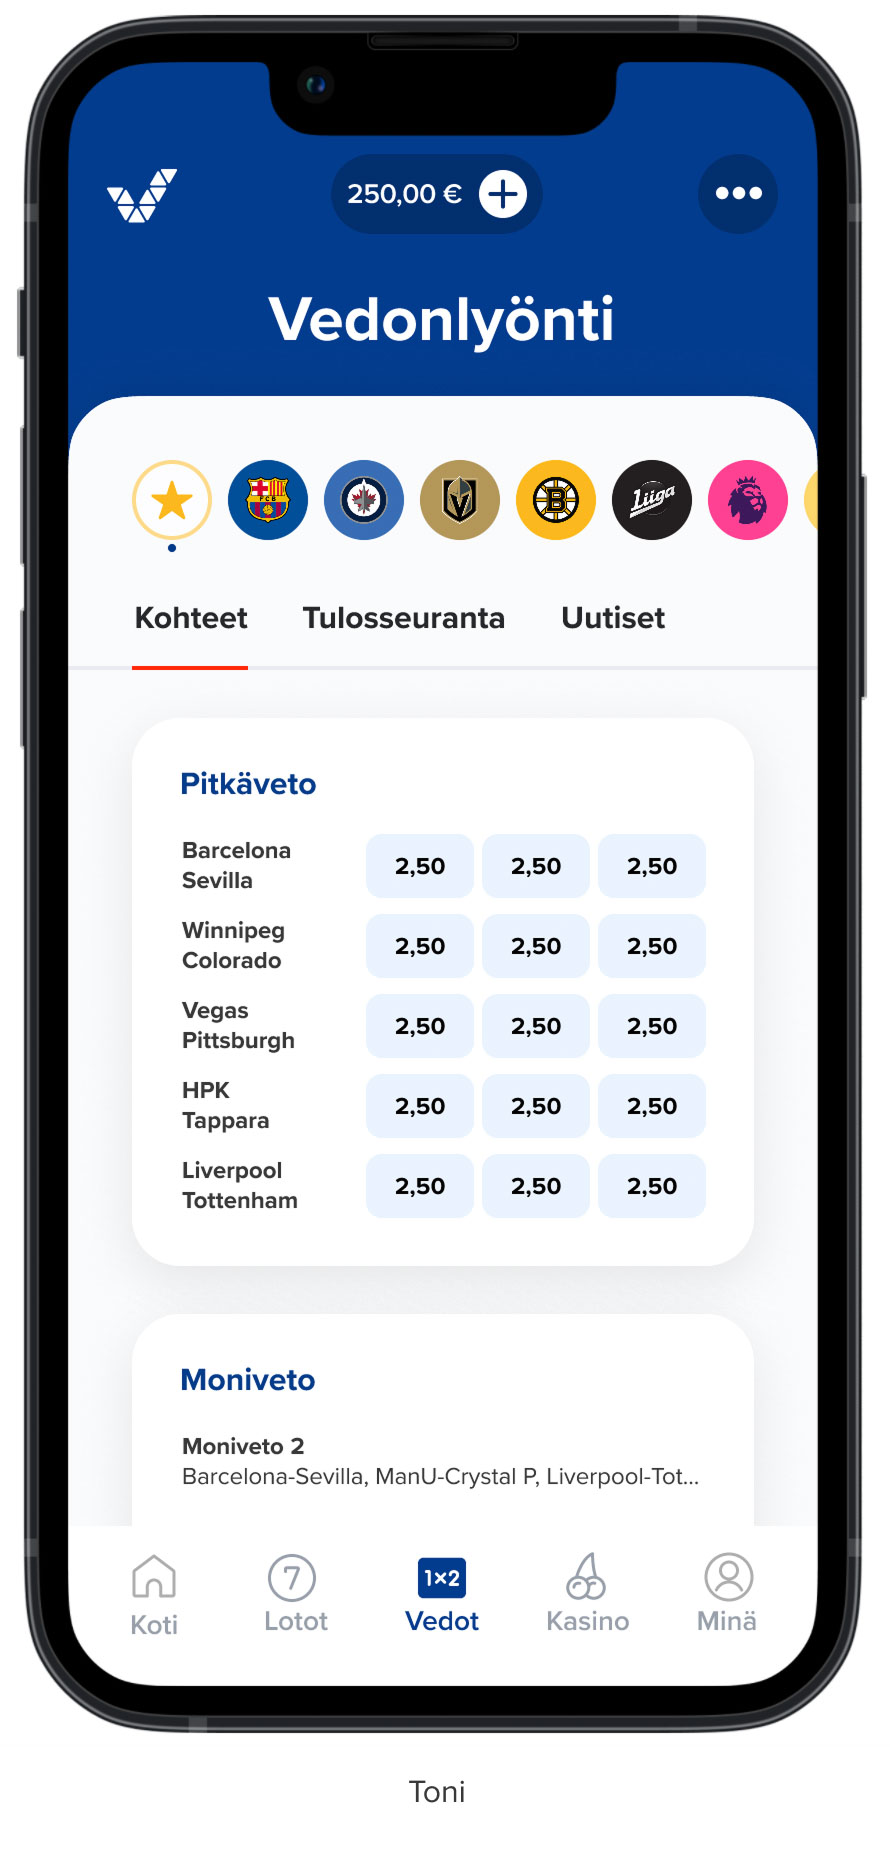
Two similar designs with personalized quick links and default leagues. Quick Links became a winning approach.
Detailed design
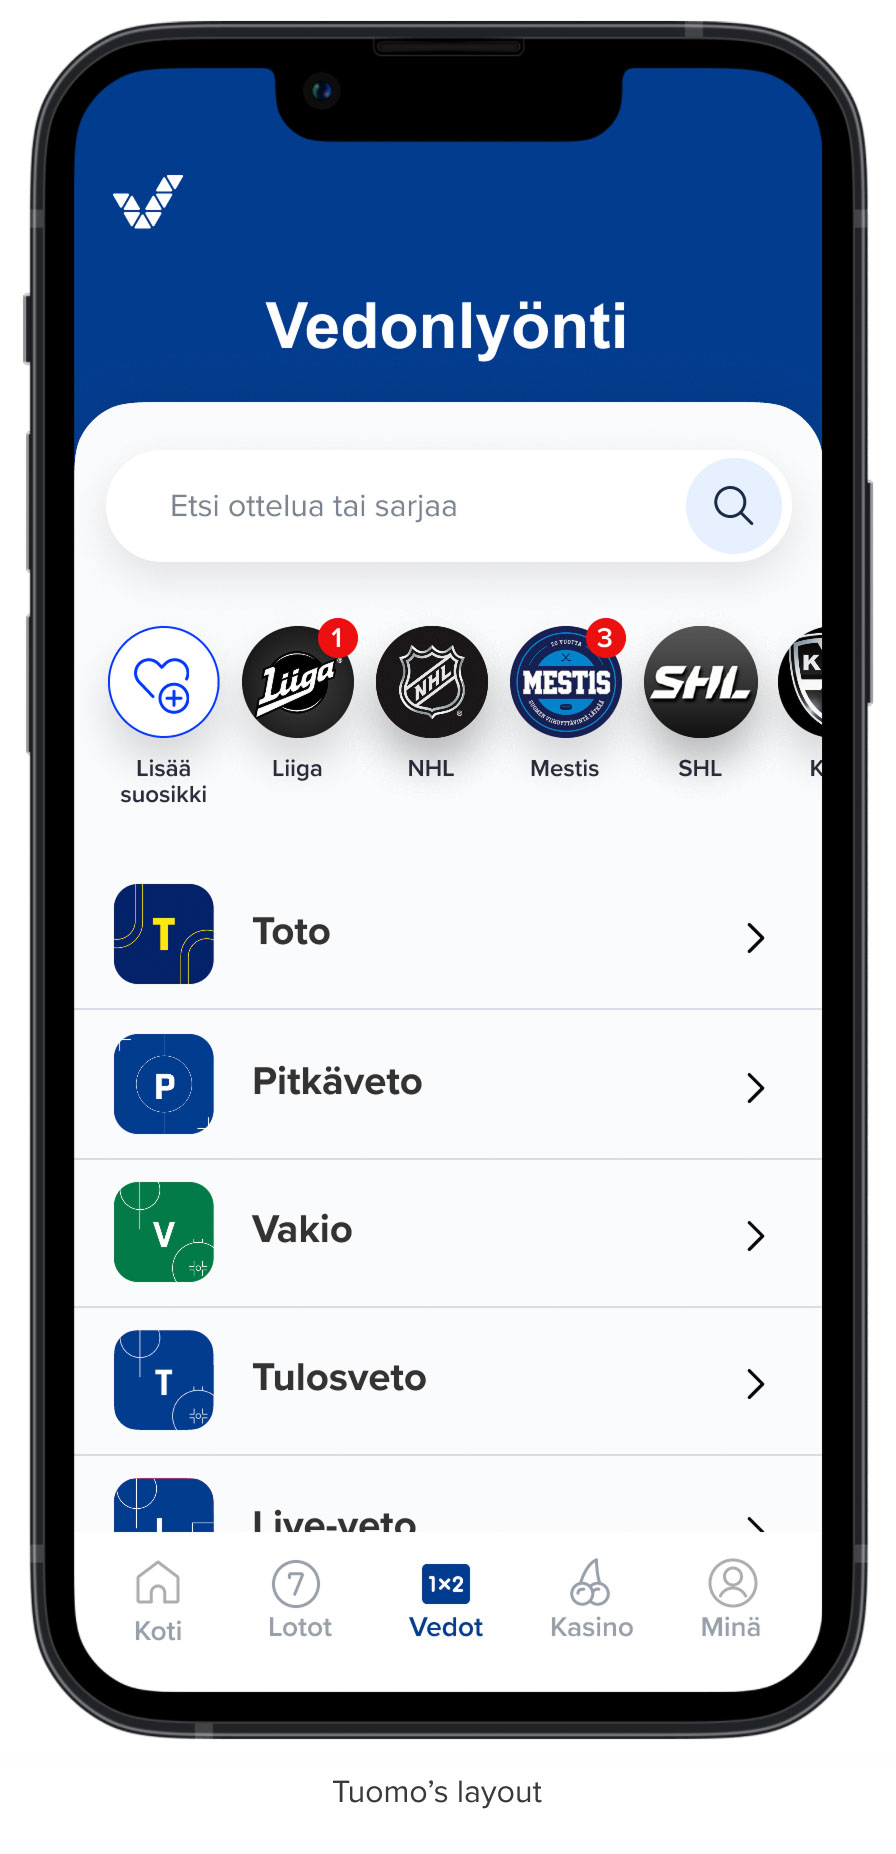
After the workshop, we designed a personalized page navigation with the fresh ideas.
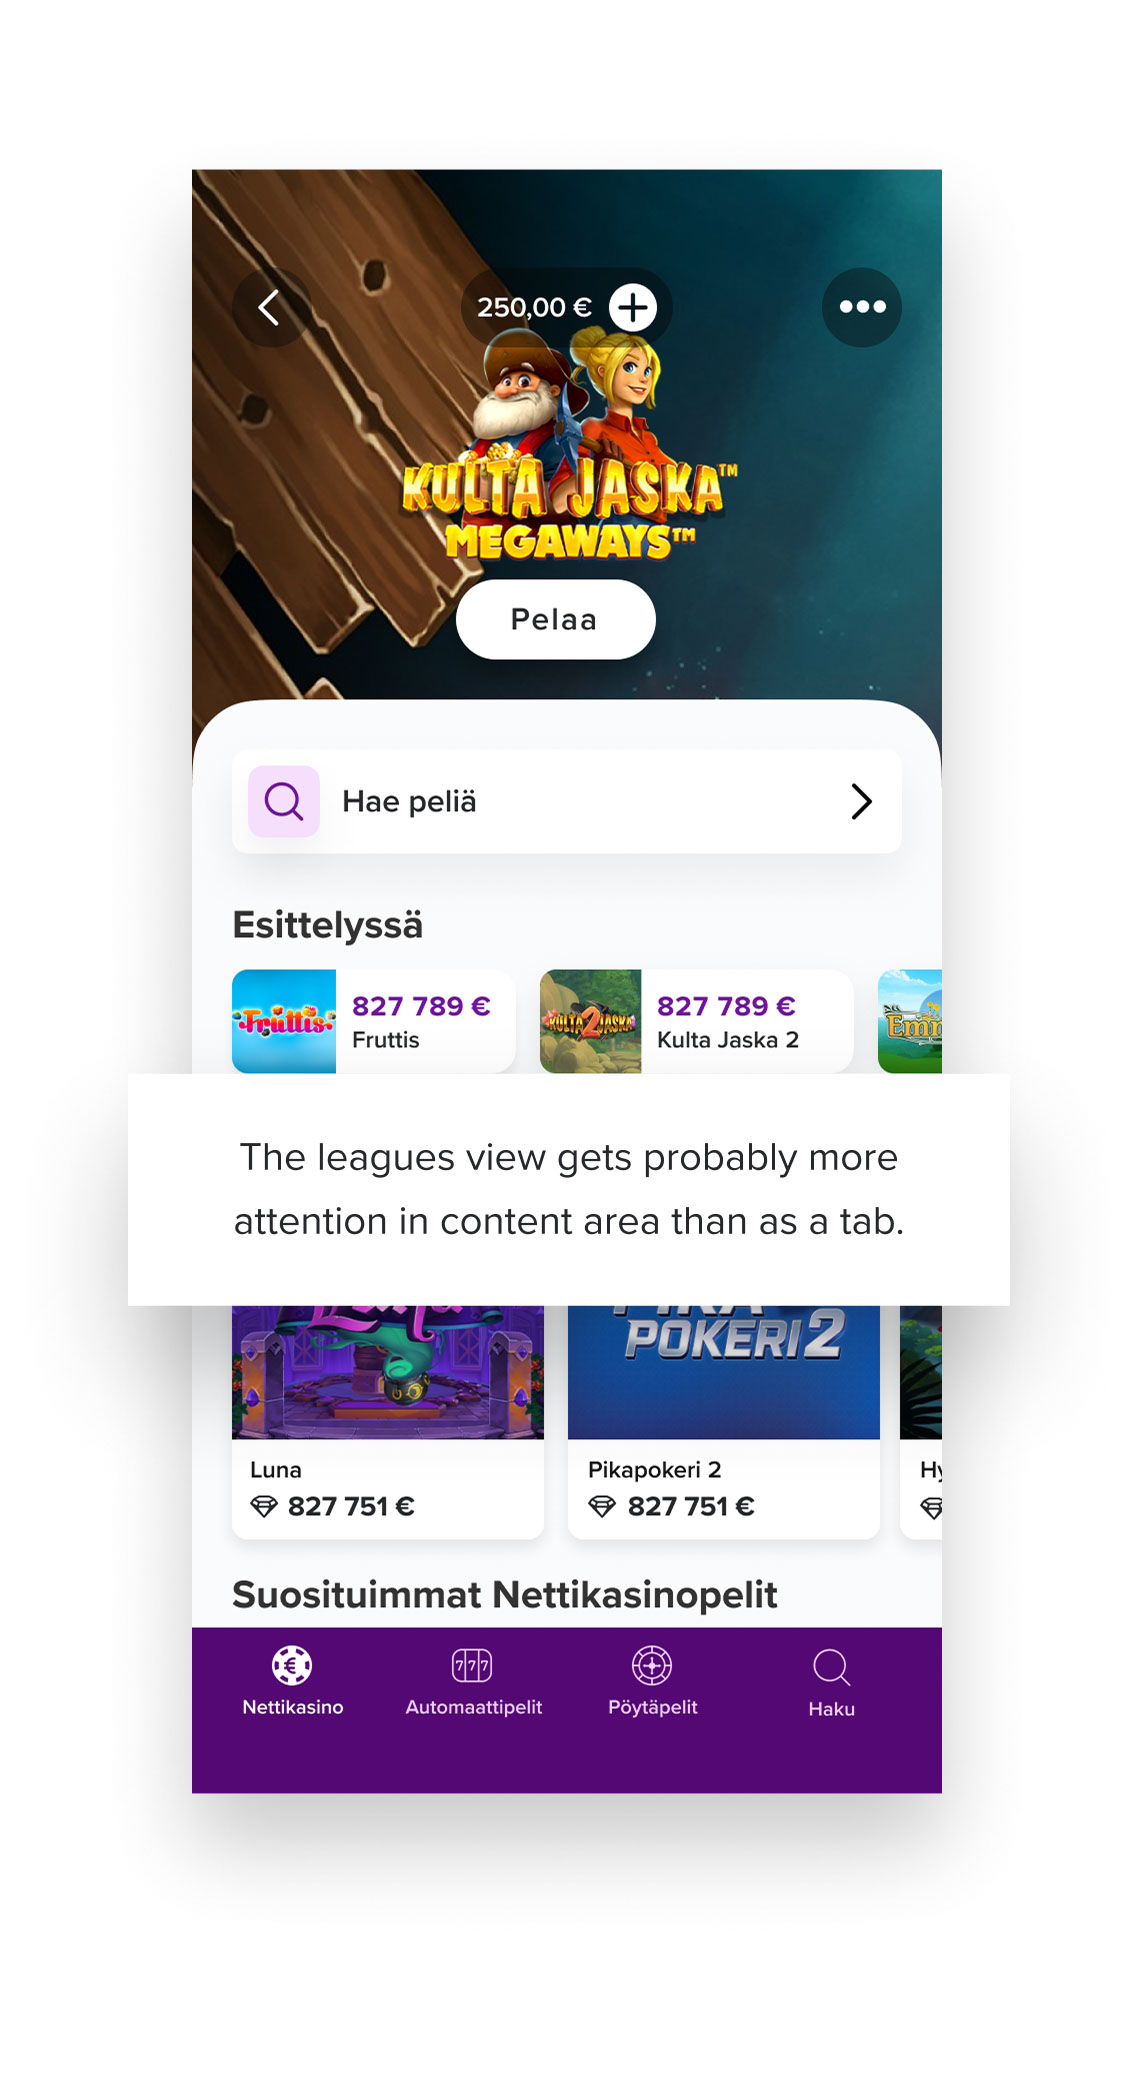
I used Tandem 2.0 design system in the full view (images above). I was part of the core team that started the system, working in its main pilot.
In more detail, I optimized cards to remove clutter and fit more content on mobile screens. This improved Tandem 2.0 card designs. My ideas boosted conversion for landing pages. Further, I promoted platform guidelines (Apple HIG, Material Design), accessibility, and usability principles.
AB testing
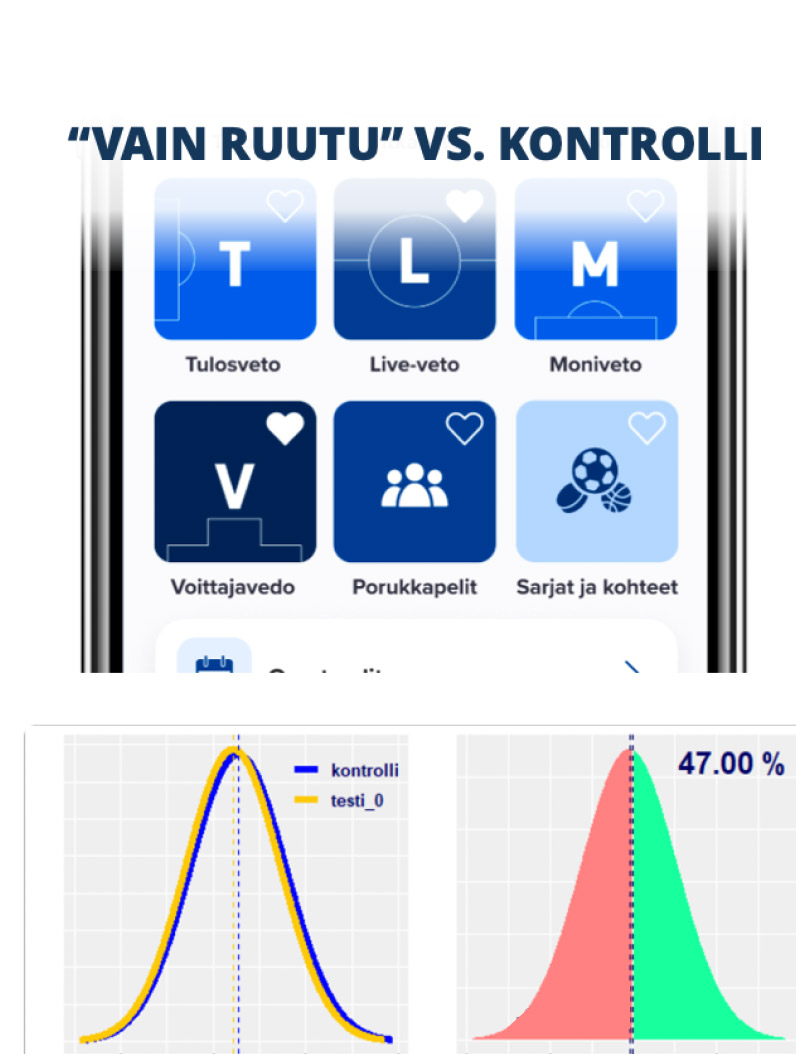
We AB tested different designs to optimize findability and conversion. Since first production versions rarely win, we iterated based on user data.
First attempt
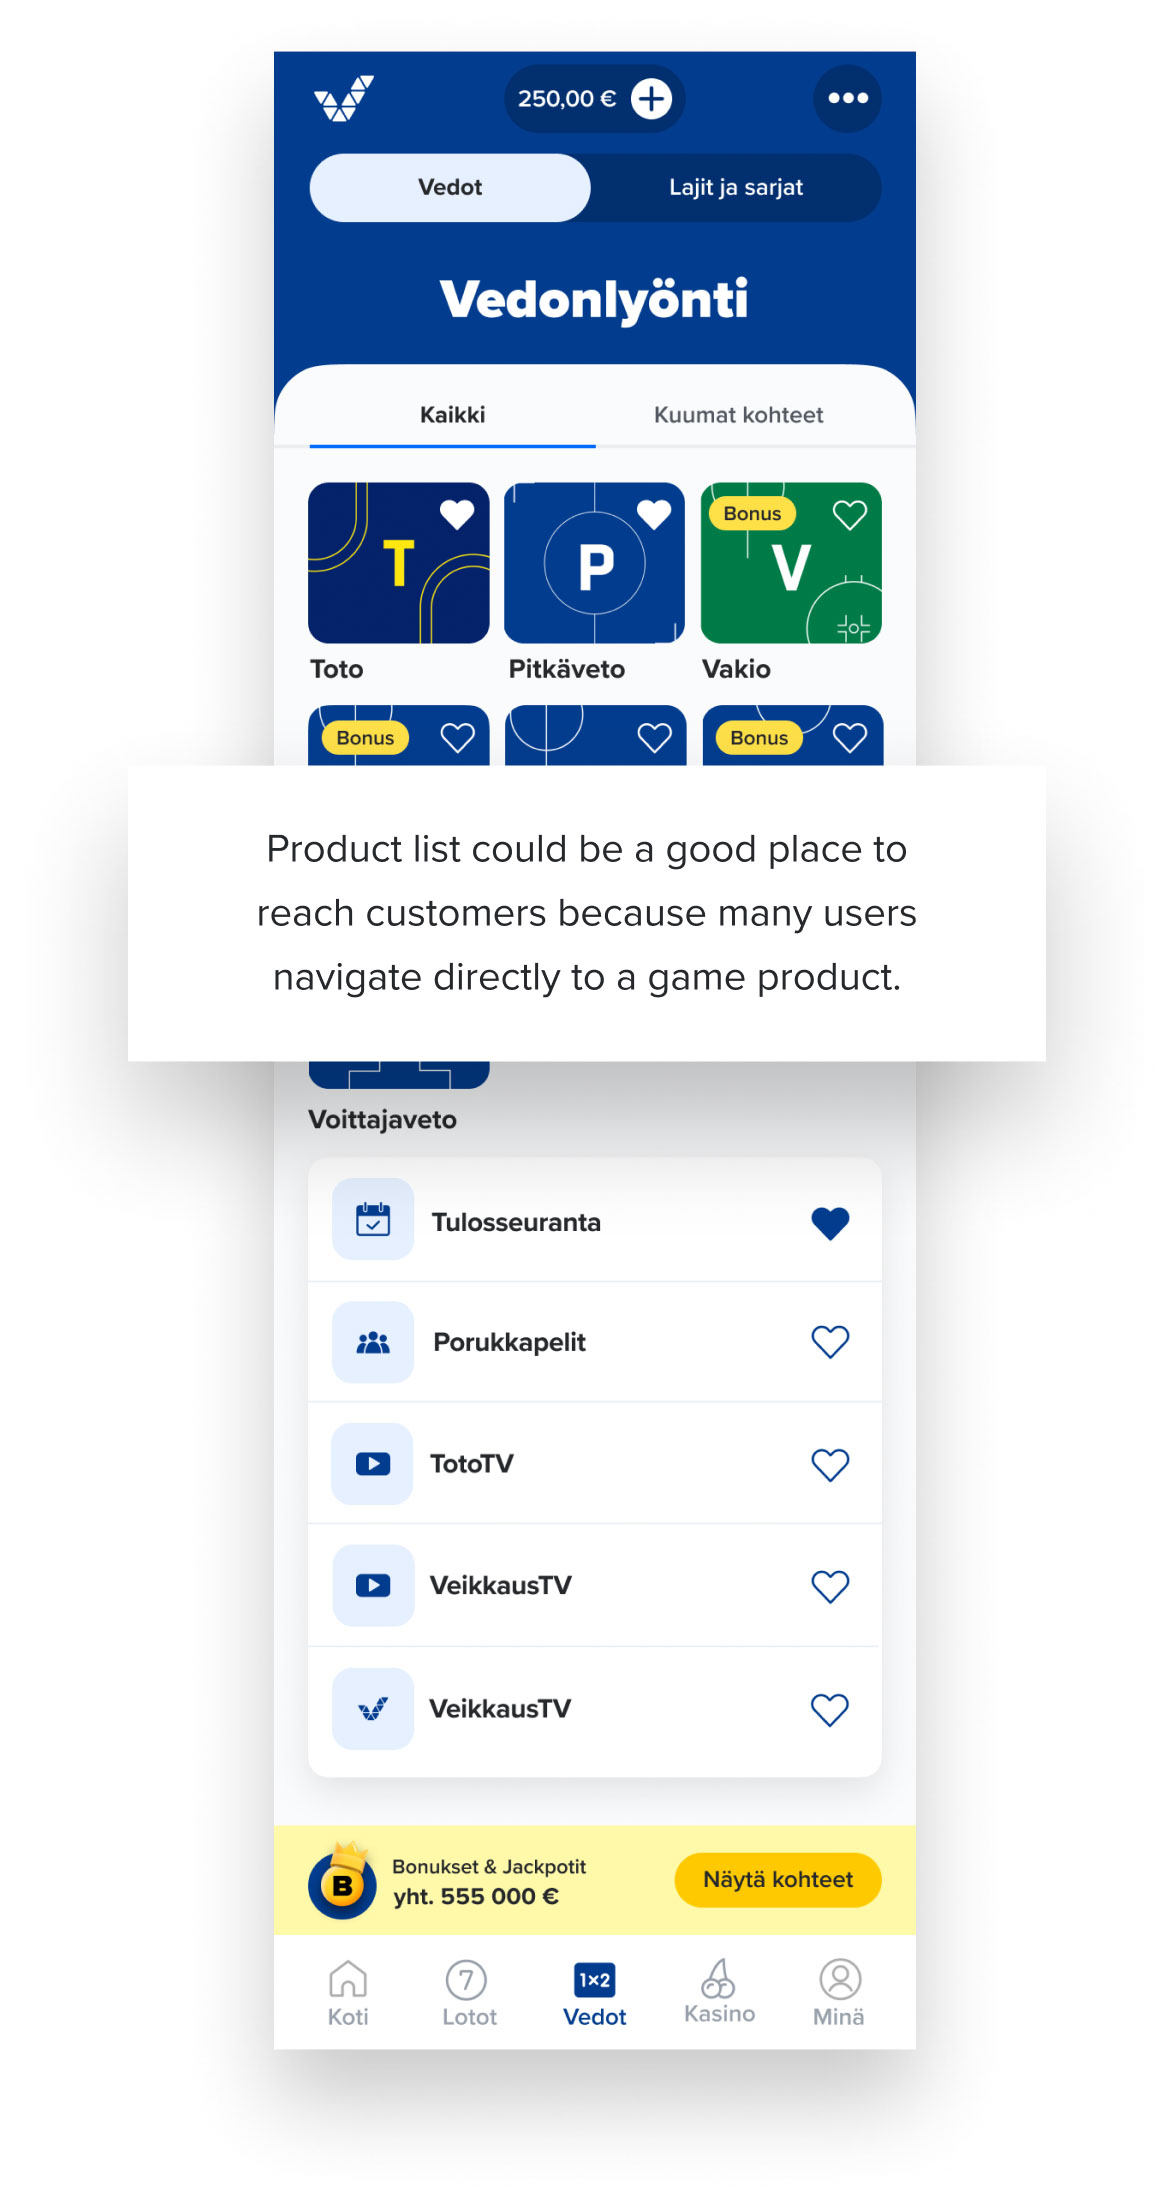
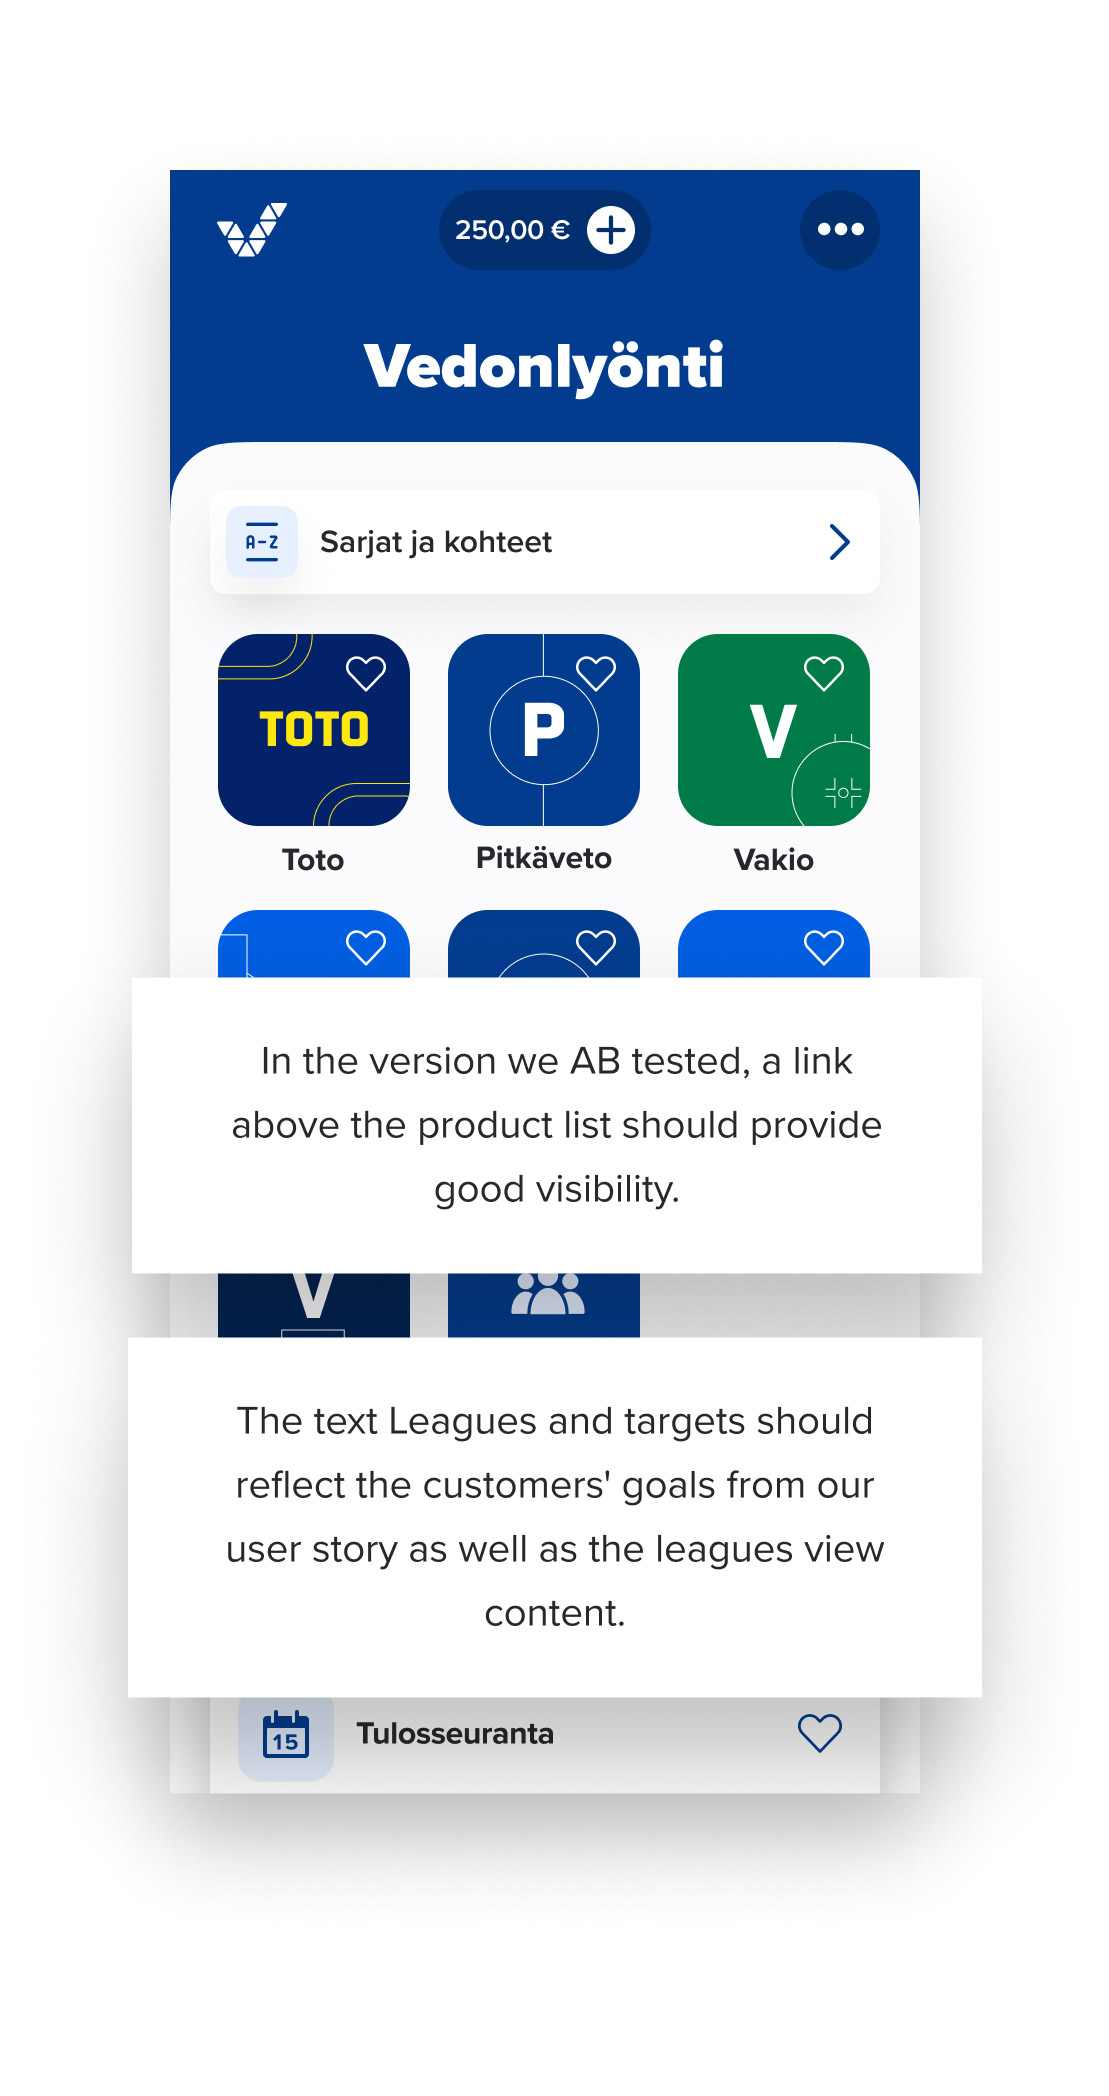
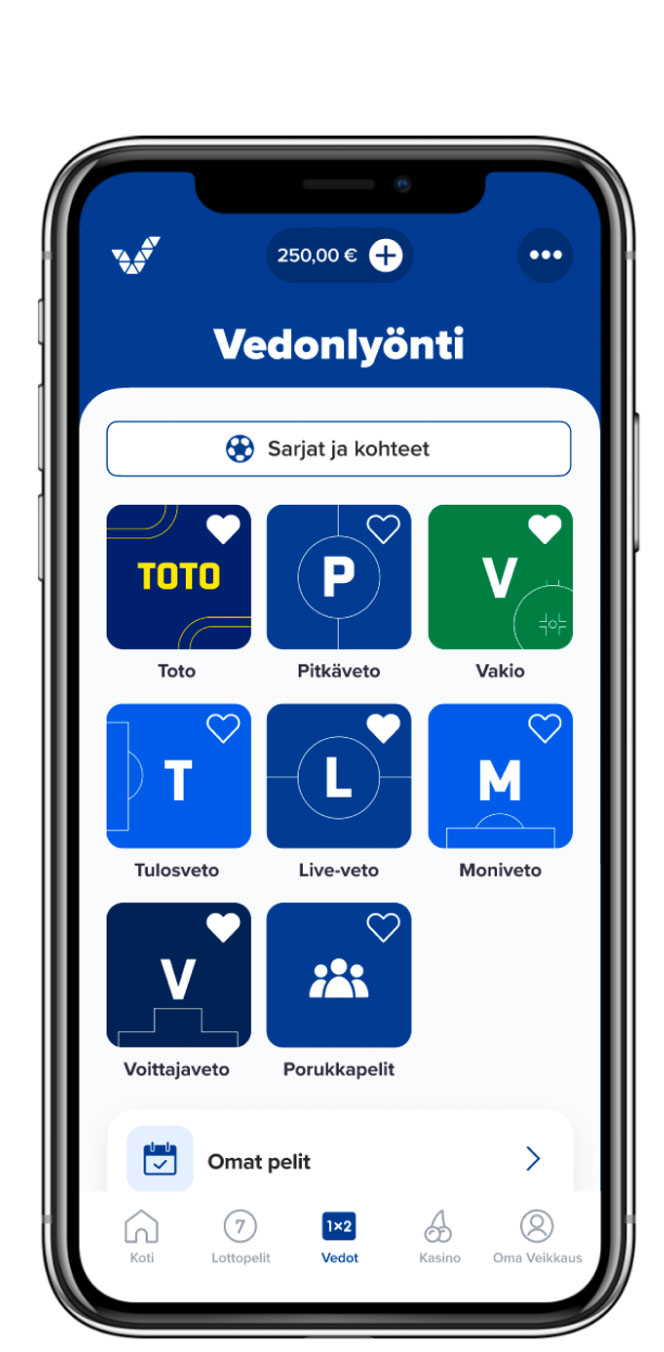
Many betting players navigate straight to individual game products. Thus, our hypothesis was that a big link above the products helps players find the Leagues view.
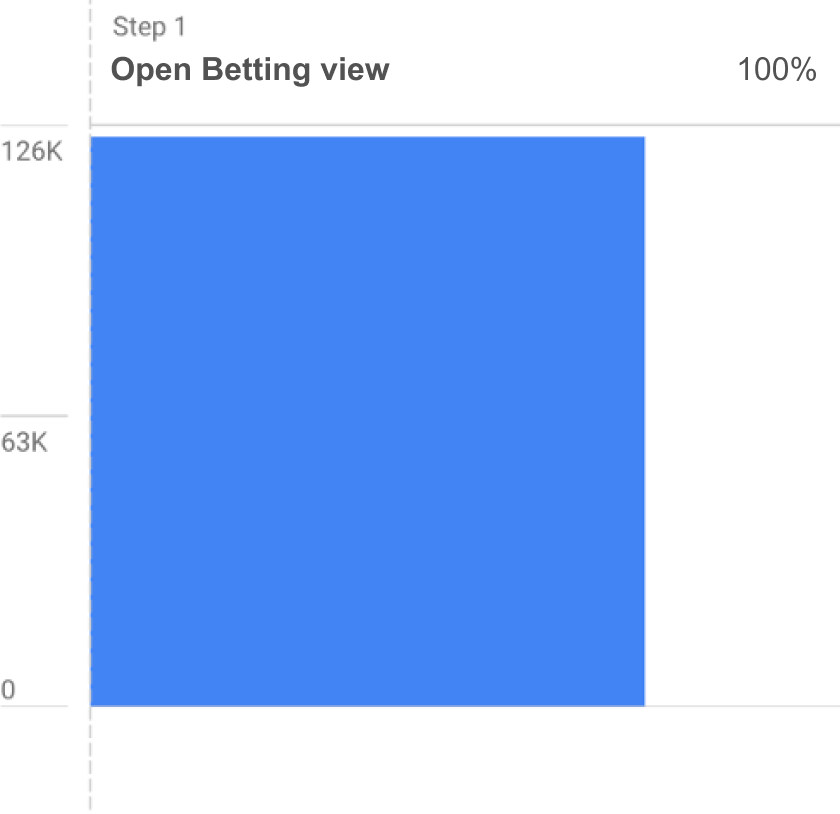
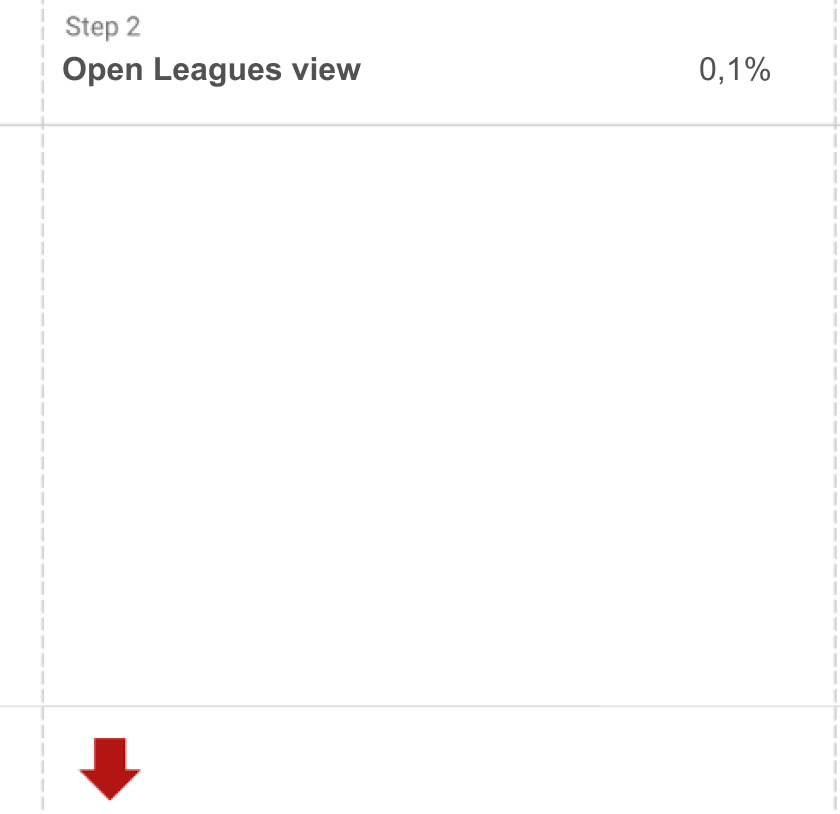
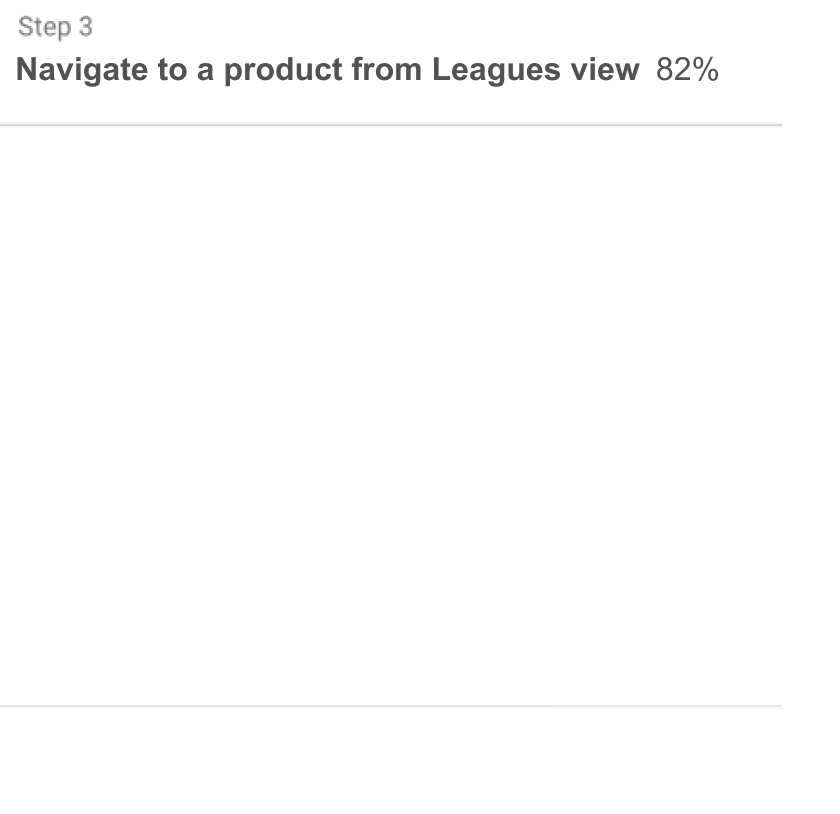
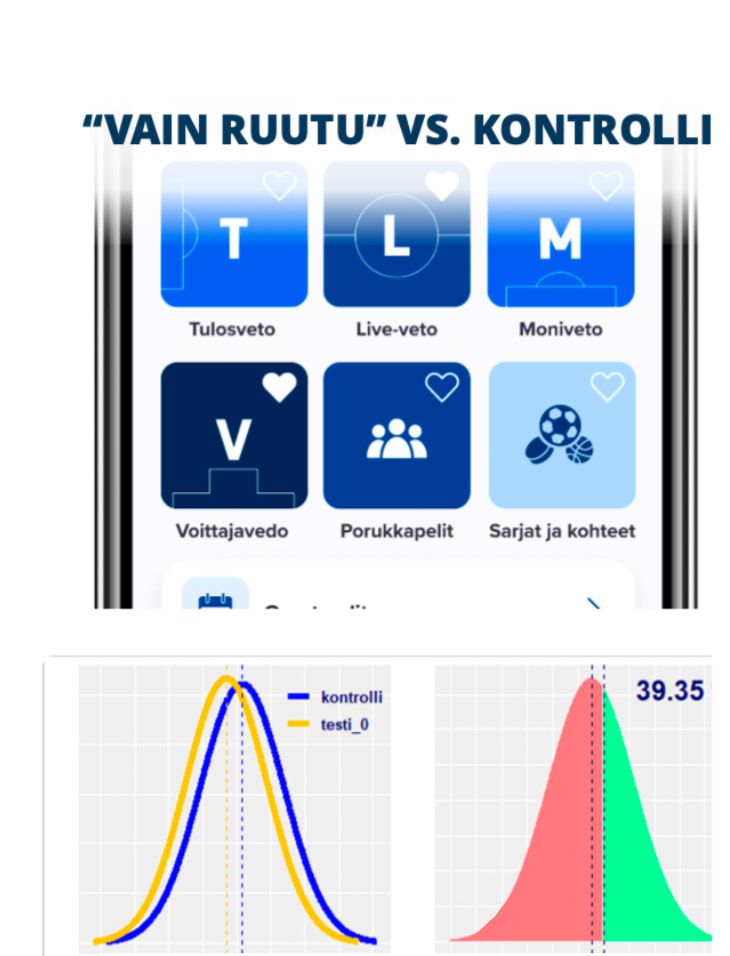
For our first AB test, we added a link right above the games (rightmost layout above). However, only 0.1% of customers clicked the link (see funnel below).
We cut the AB test short based on the initial data I analyzed. Maybe visibility isn’t always enough for findability?
Navigation design
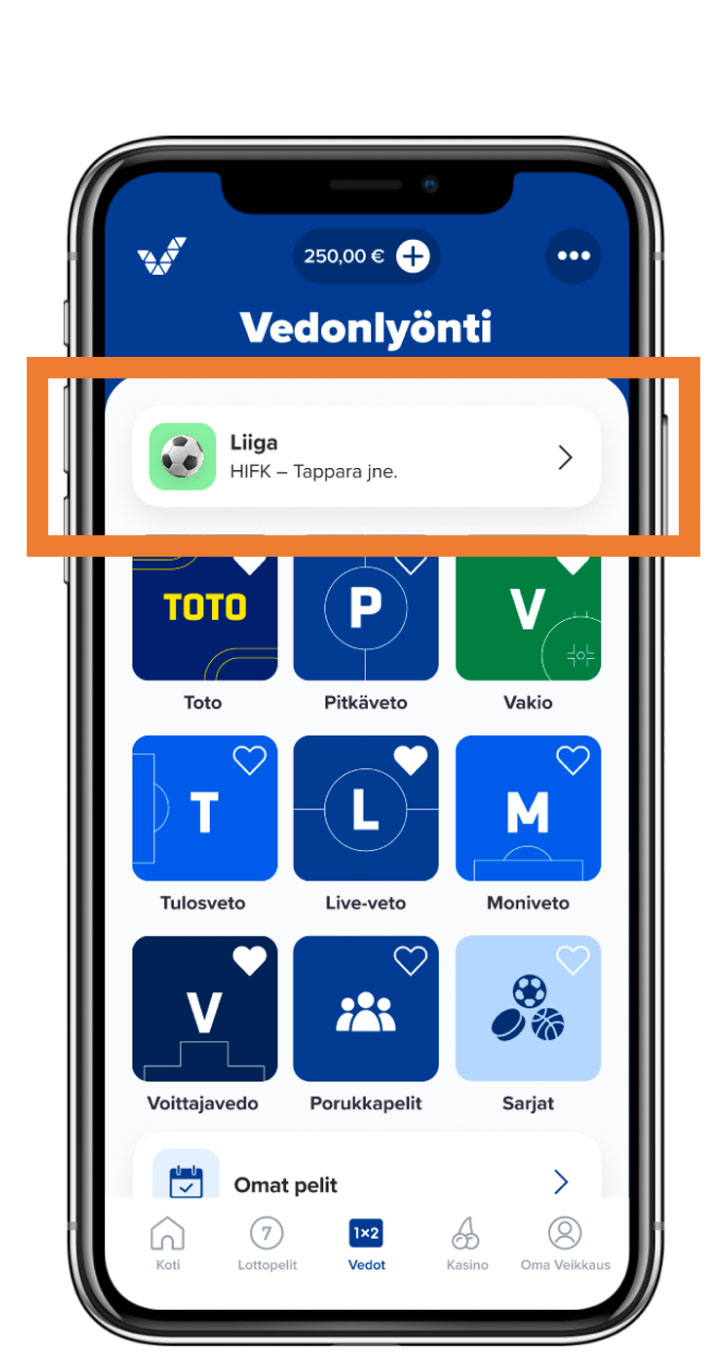
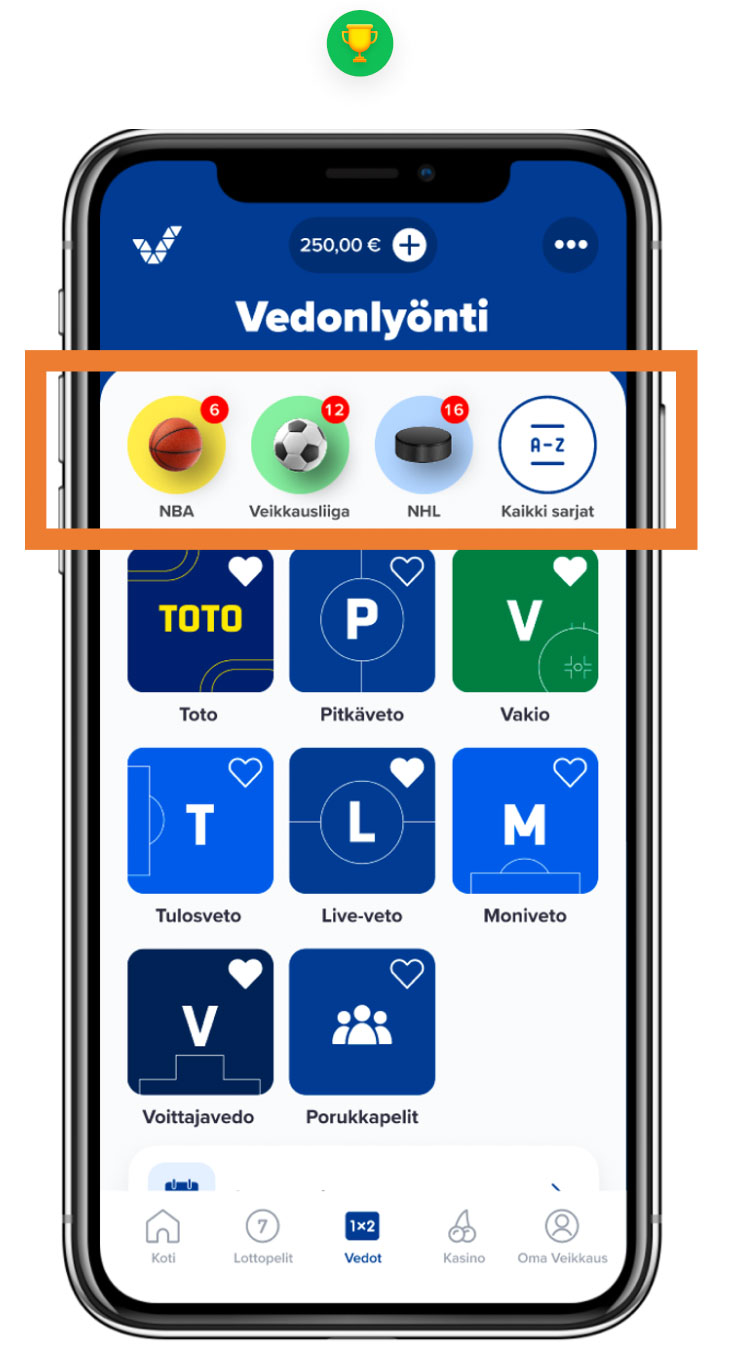
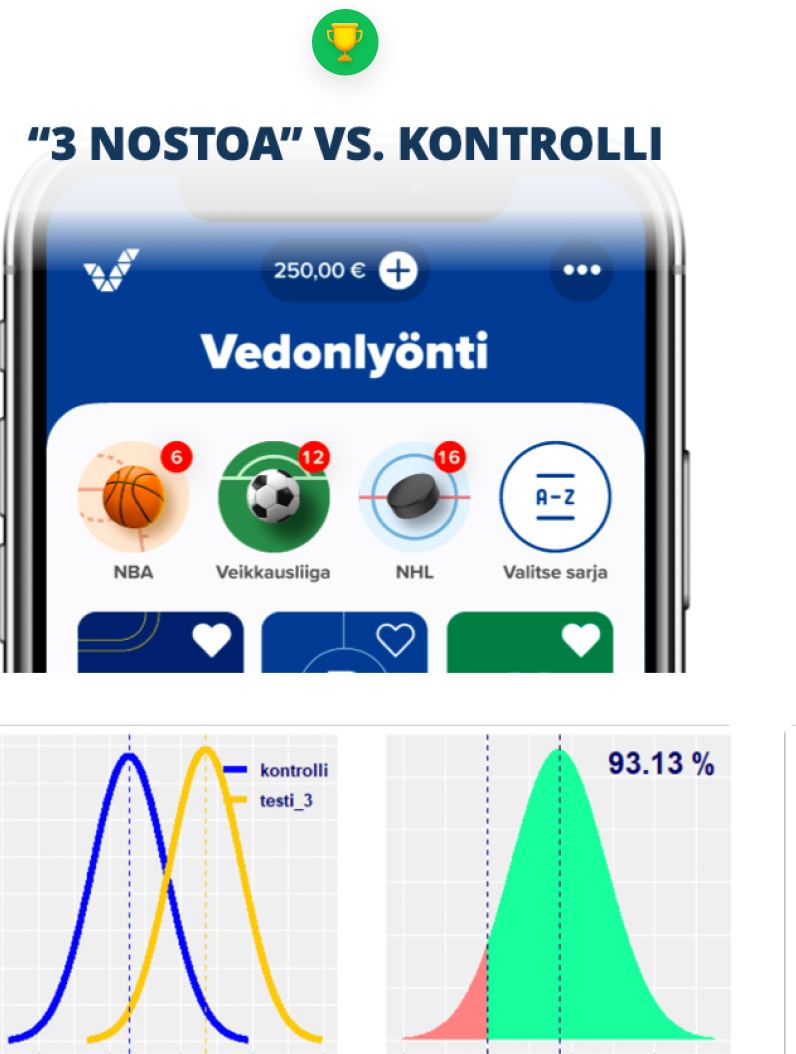
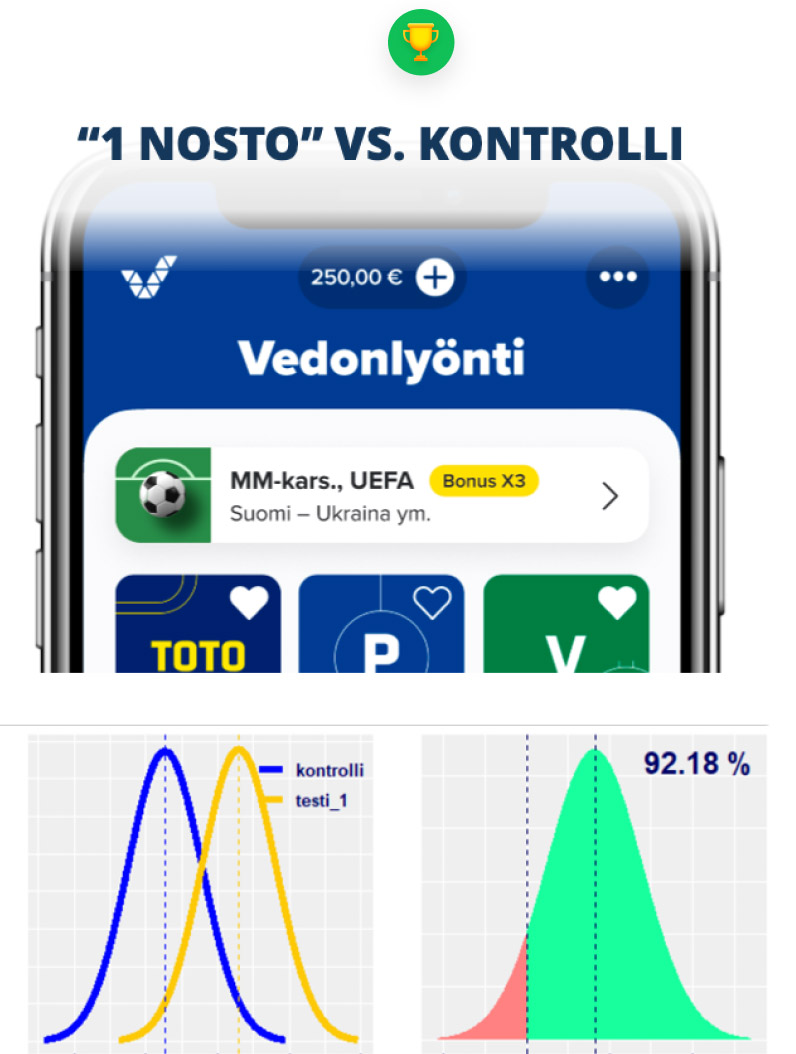
In a second ABC test, I designed a personalized navigation that mirrored our user story (center image). Then Timo and Petteri used outputs from our earlier brainstorming for their design (rightmost image).
Jarno developed an offline collaborative filtering model. This supports high-frequency customers and hundreds of leagues. Both UI versions were built on the model.
Results
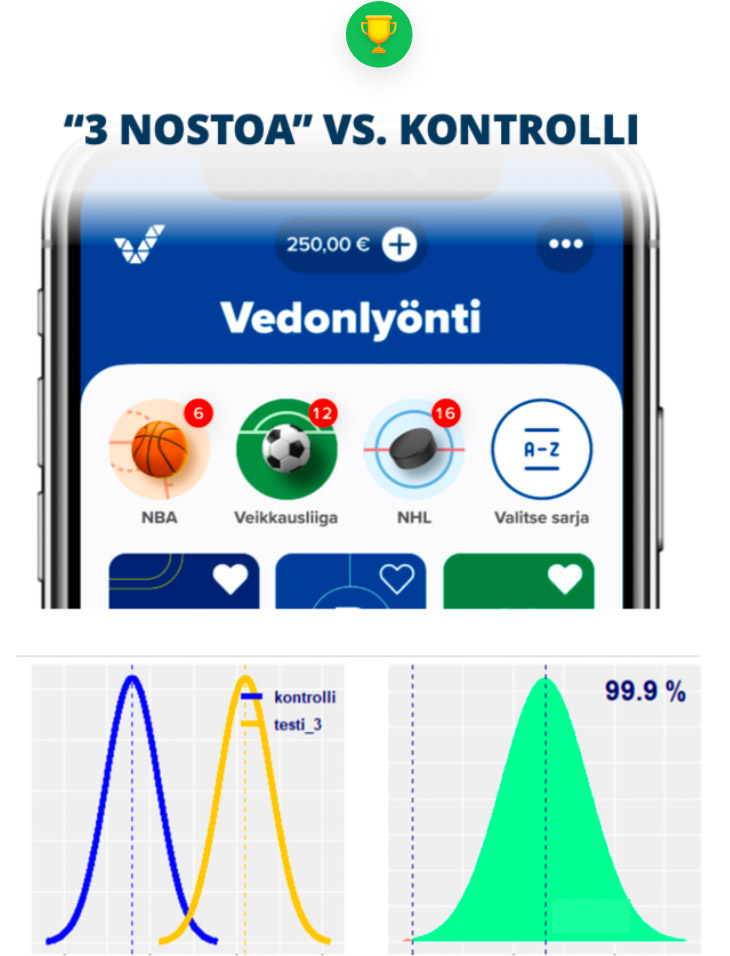
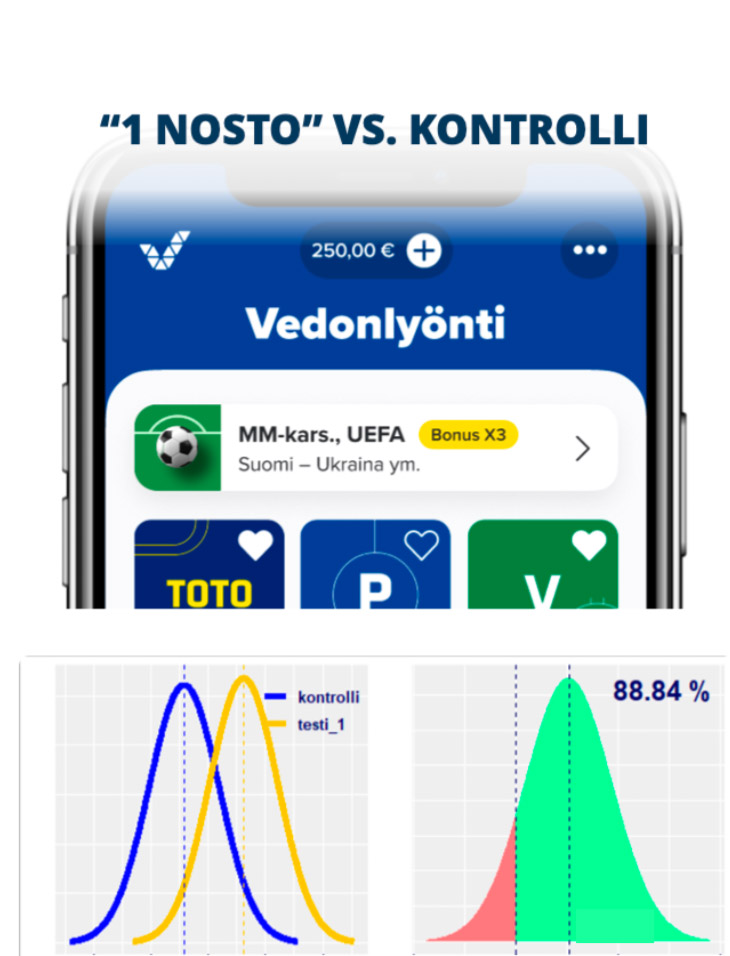
Overall, the second ABC test was a success. Several key metrics improved.
Number of purchased products
Both new versions raised the average number of betting products per customer by +2%.
Sales conversion
Both versions converted well. However, the list version performed best. It boosted app betting +3%.
Final design
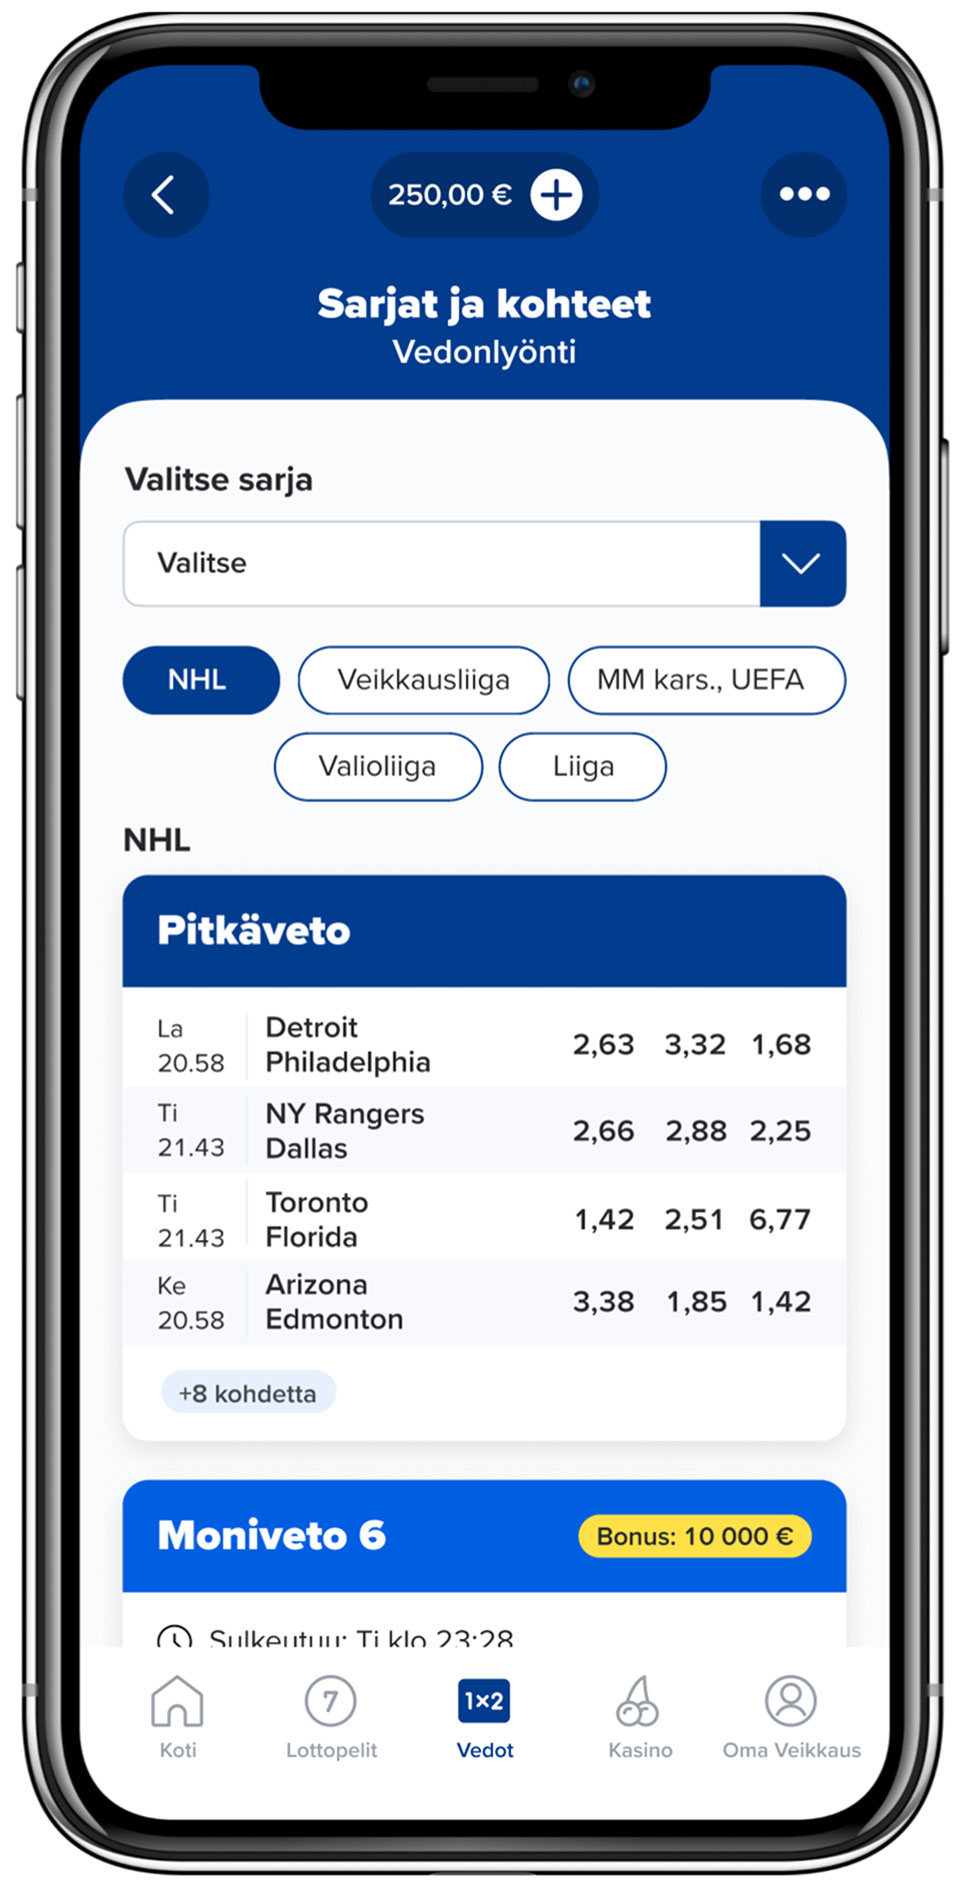
The Leagues view became the app’s 3rd most popular betting view! Impressively, Samppa coded all of its frontend in just a few weeks.
Thanks for reading this case study.
 Teemu Talja
