
I want to keep my waist size and weight within a normal range. That doesn’t always happen. Why do I gain weight even though I eat the same as before?
I’ve been keeping an exercise log and a food diary. This time, I also tracked my activity and heart rate. I used a Polar H7 heart rate chest strap and iPhone apps for the measurements. The apps all used the same heart rate data, since I ran them at the same time.
Based on these observations, I built a simple heart rate–based calorie calculator, since readers are probably interested in their own energy use. It makes it easy to estimate your personal calorie burn.

» E-biking
» Yoga
» Heart rate apps
E-biking
Strava looked promising, since you can select e-biking as the activity type. Unfortunately, it doesn’t use heart rate data to calculate calories, so it falls a bit short. It does show a heart rate graph, though.
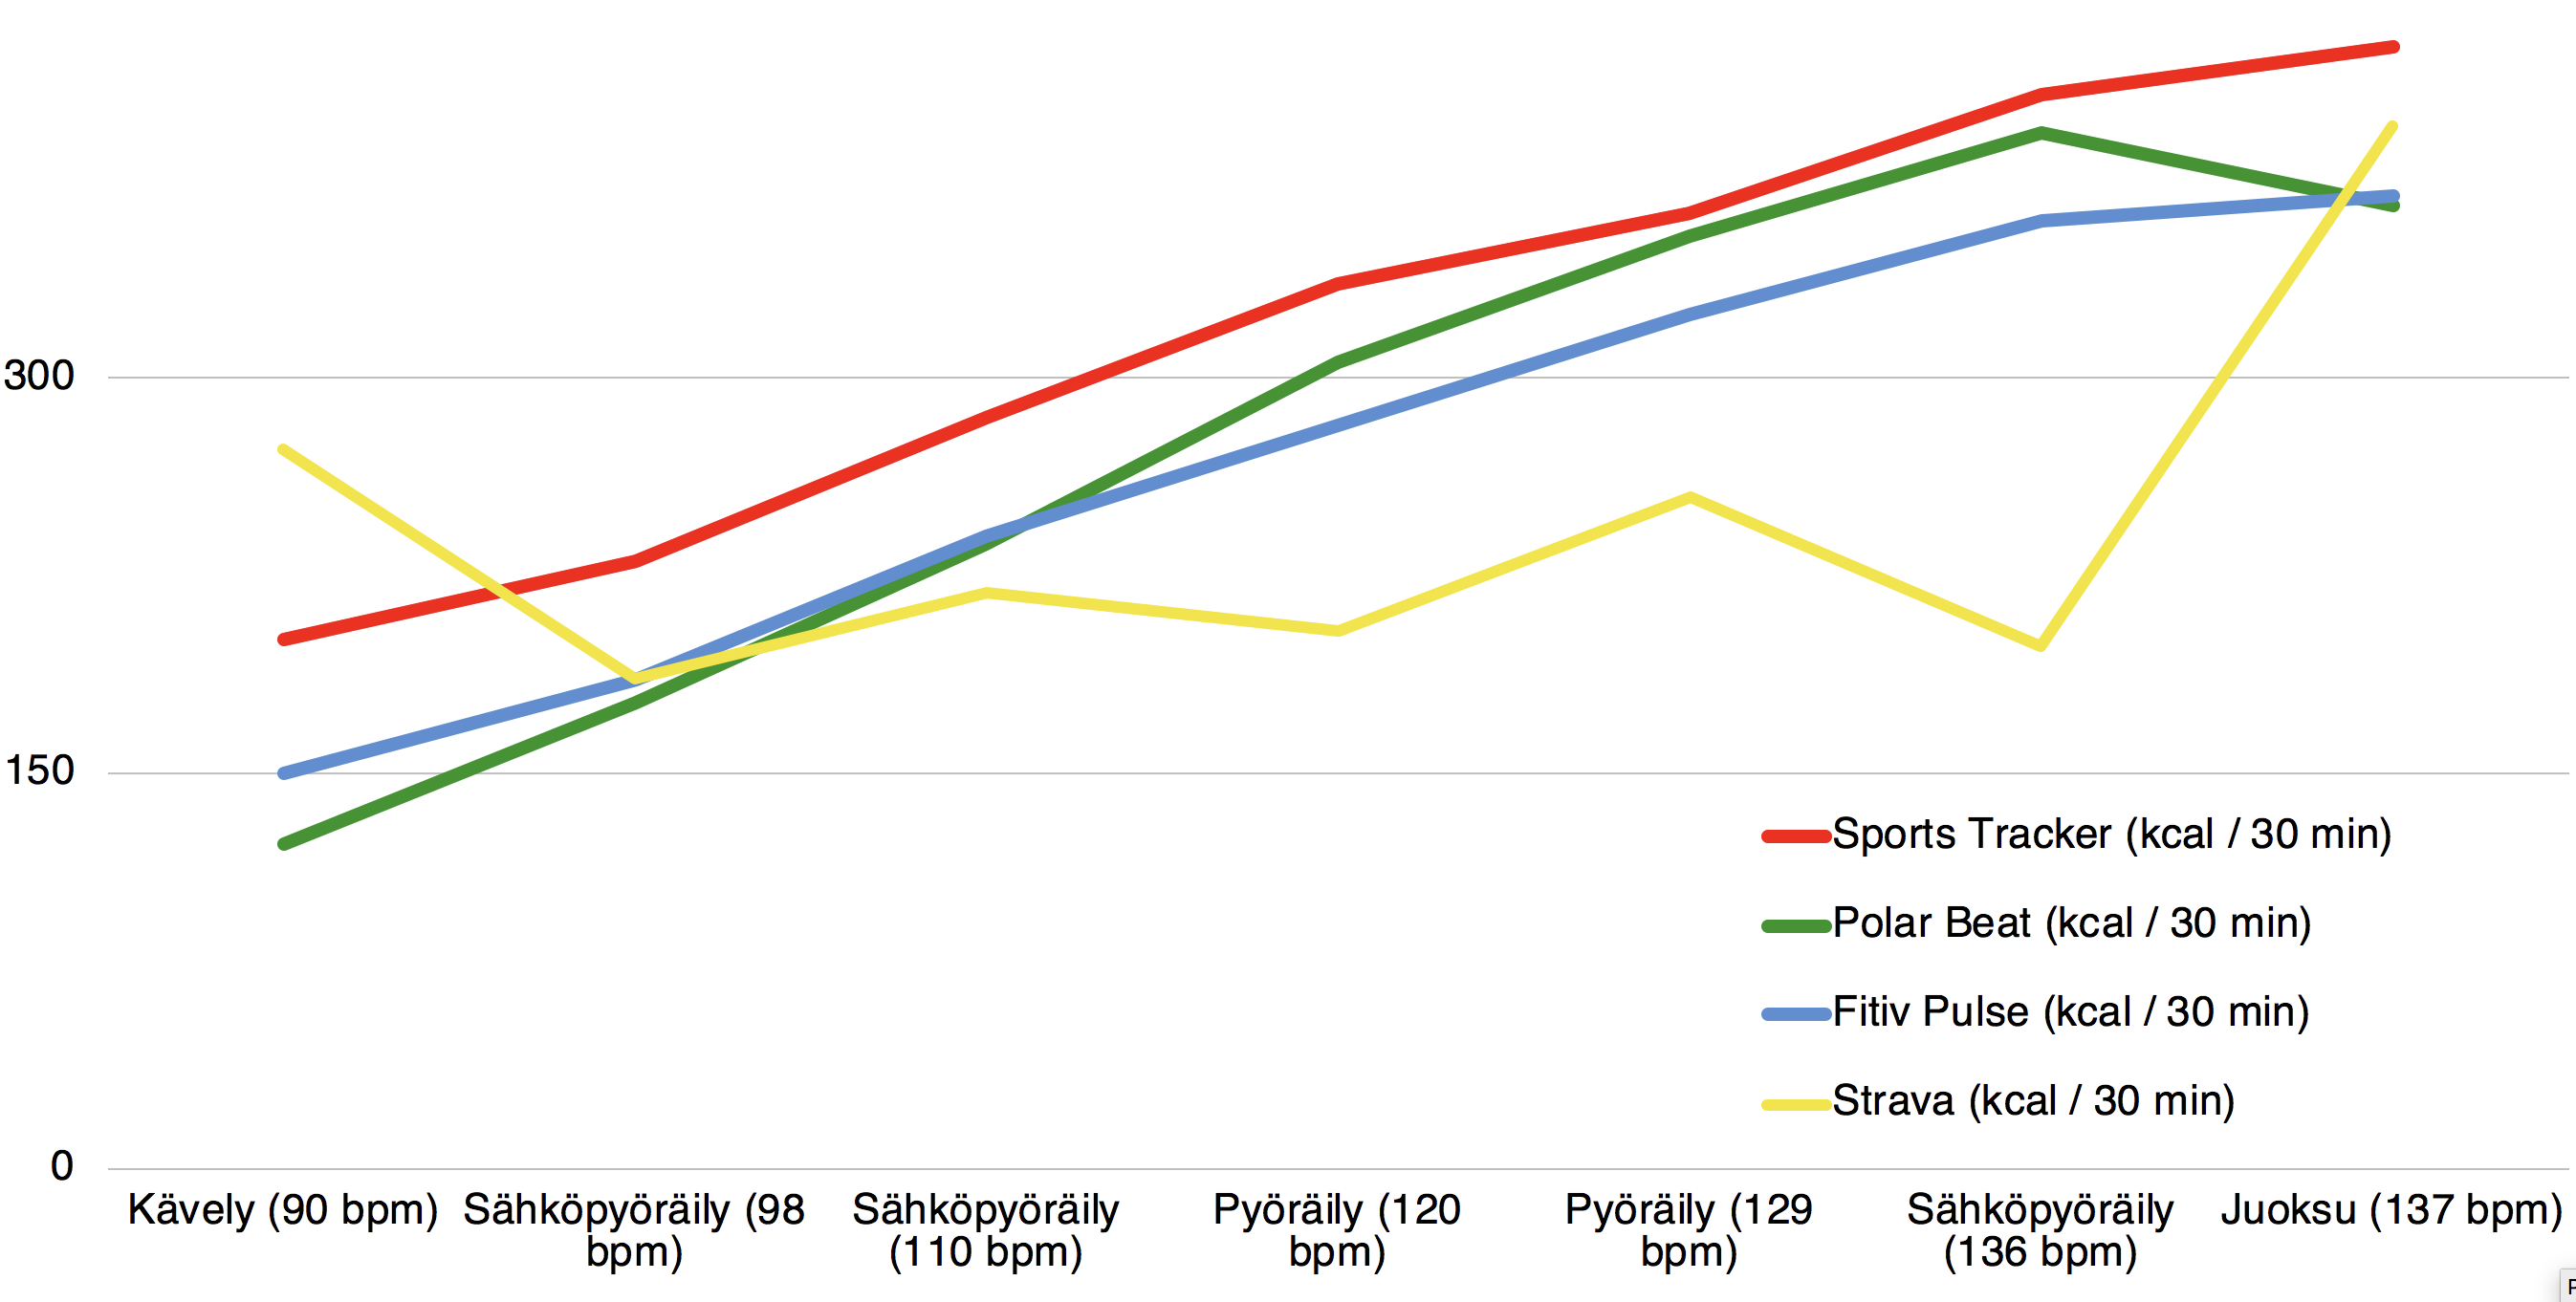
In snow, in a hurry, and with a fading battery, e-biking (136 bpm) burned only about 10% more energy than e-biking in easy conditions (98 bpm), according to Strava. In other apps, the difference is closer to 100%. Unlike Strava, they also show energy use increasing fairly steadily as heart rate goes up.
Sports Tracker and Strava looked surprisingly similar as apps. However, Sports Tracker does use heart rate data to calculate calories.
The effect of electric assistance
When we got our e-bike, it felt amazing to cover twice the distance in the same amount of time. Every kilometer felt shorter than on a “normal” bike.
You’d think that stronger electric assist would make pedaling easier. But the measurements showed something different: my heart rate and calories burned actually went up when I increased the assist level (see the chart below). On Steps e-bikes, Eco is a lighter assist mode than Normal.
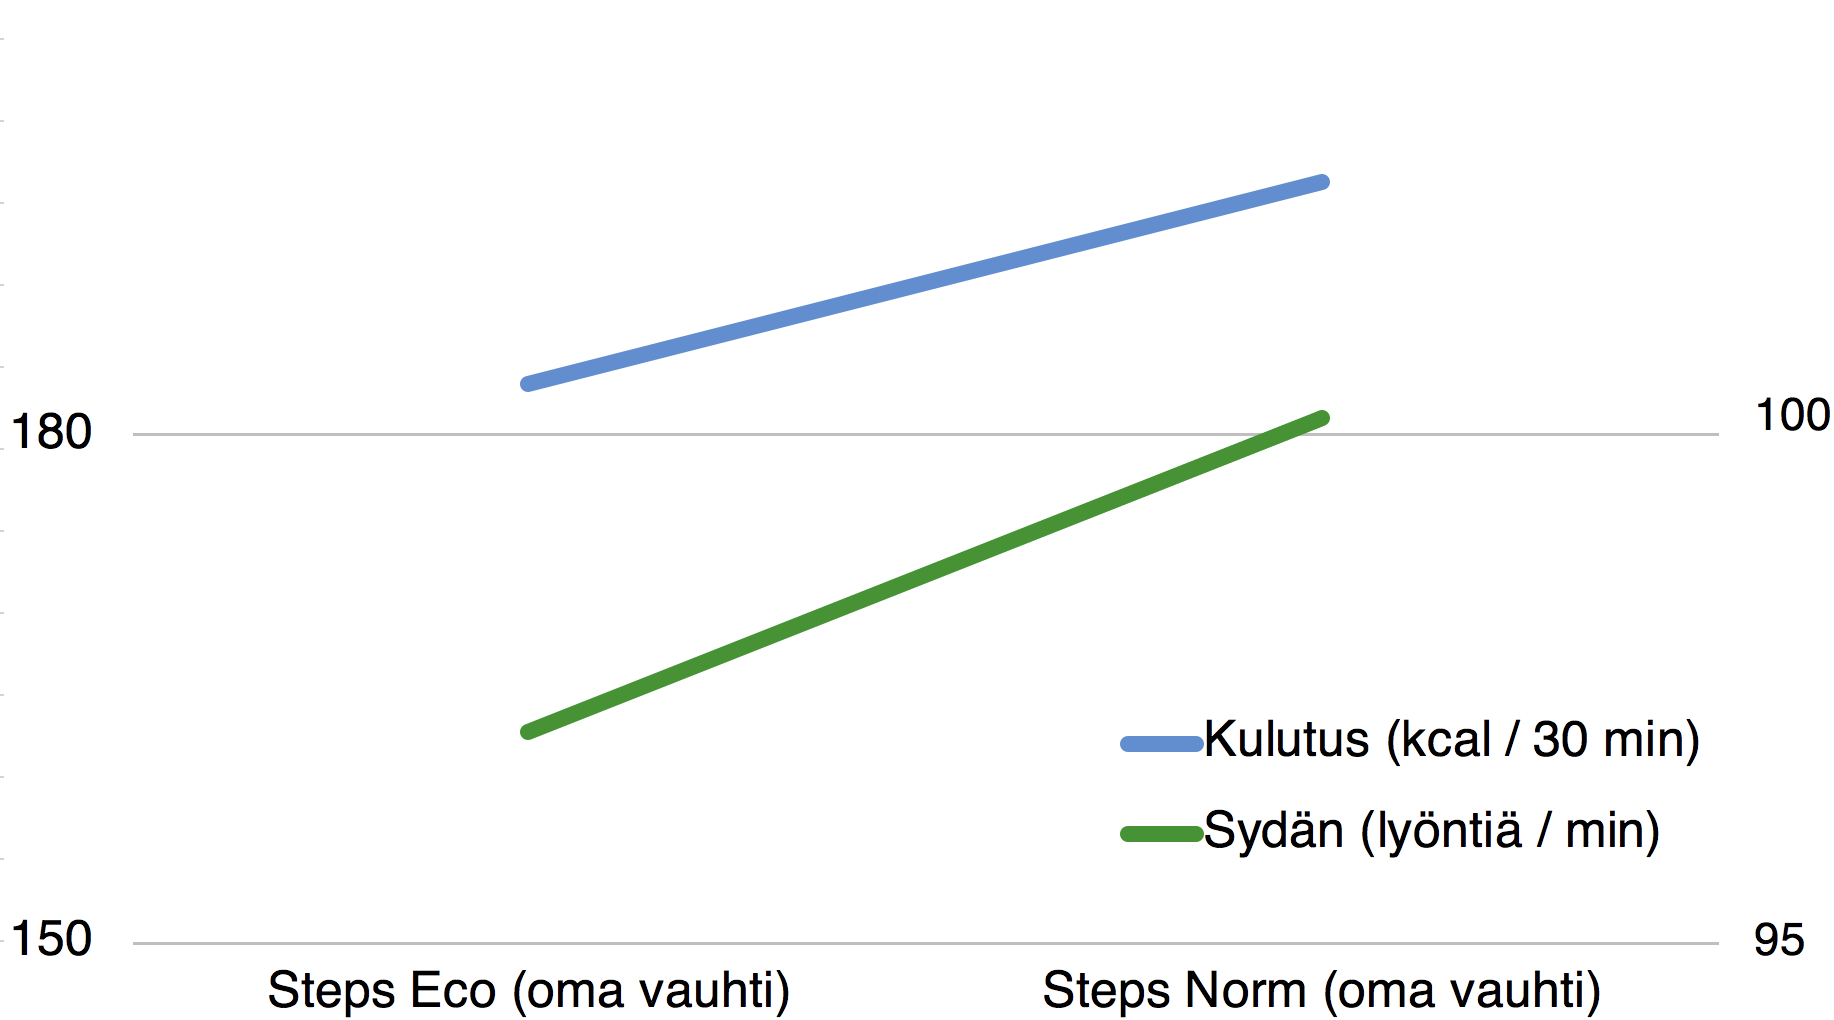
Even though the stronger Normal assist burned more energy per minute, the total energy use was sometimes a bit higher with Eco, simply because the ride took longer. The measurements in the chart come from two Monday-morning commutes on the same route, one week apart. The weather and my level of hurry were about the same.
The tables below show how much energy my commute used when biking or running in different conditions. The numbers are based on a body weight of 87 kg and a resting heart rate of 50 bpm.
| Weather | In a hurry | Energy use (kcal / 0.5 h) |
|---|---|---|
| Decent winter weather | No | 185–195 |
| Yes | 235–250 | |
| Snow on the ground (5+ cm) | No | 215–230 |
| Yes | 240–260 | |
| Early spring (no snow, no studs) | No | 150-175 |
| Yes | 200–230 |
| Weather | In a hurry | Energy use (kcal / 0.5 h) |
|---|---|---|
| Snow on the ground (5+ cm) | No | 275–280 |
| Yes | 300–335 | |
| Early spring (no snow, clip-in pedals) | No | 215–275 |
| Yes | 265–335 |
The energy column refers to active energy. Active energy means total energy minus what the body would burn at rest. If I wasn’t biking, I’d probably be sitting or standing in the bus. The resting burn has been subtracted from the numbers (about 40–60 kcal per 30 minutes).
| Weather | In a hurry | Energy use (kcal / 0.5 h) |
|---|---|---|
| Snow on the ground (5+ cm) | No | 365–385 |
Measuring tools — GPS and heart rate
GPS speed doesn’t give a reliable picture of energy use. For example, soft snow and light assist with a headwind likely burn more than riding at the same speed in summer with full assist and a tailwind.
I logged the energy use for e-biking and regular cycling in Polar Beat and Fitiv Pulse using the stationary bike (spinning) mode, since that mode shouldn’t rely on GPS speed and instead uses only heart rate. In Strava and Sports Tracker I used the cycling mode, because those apps don’t have a stationary-bike option.
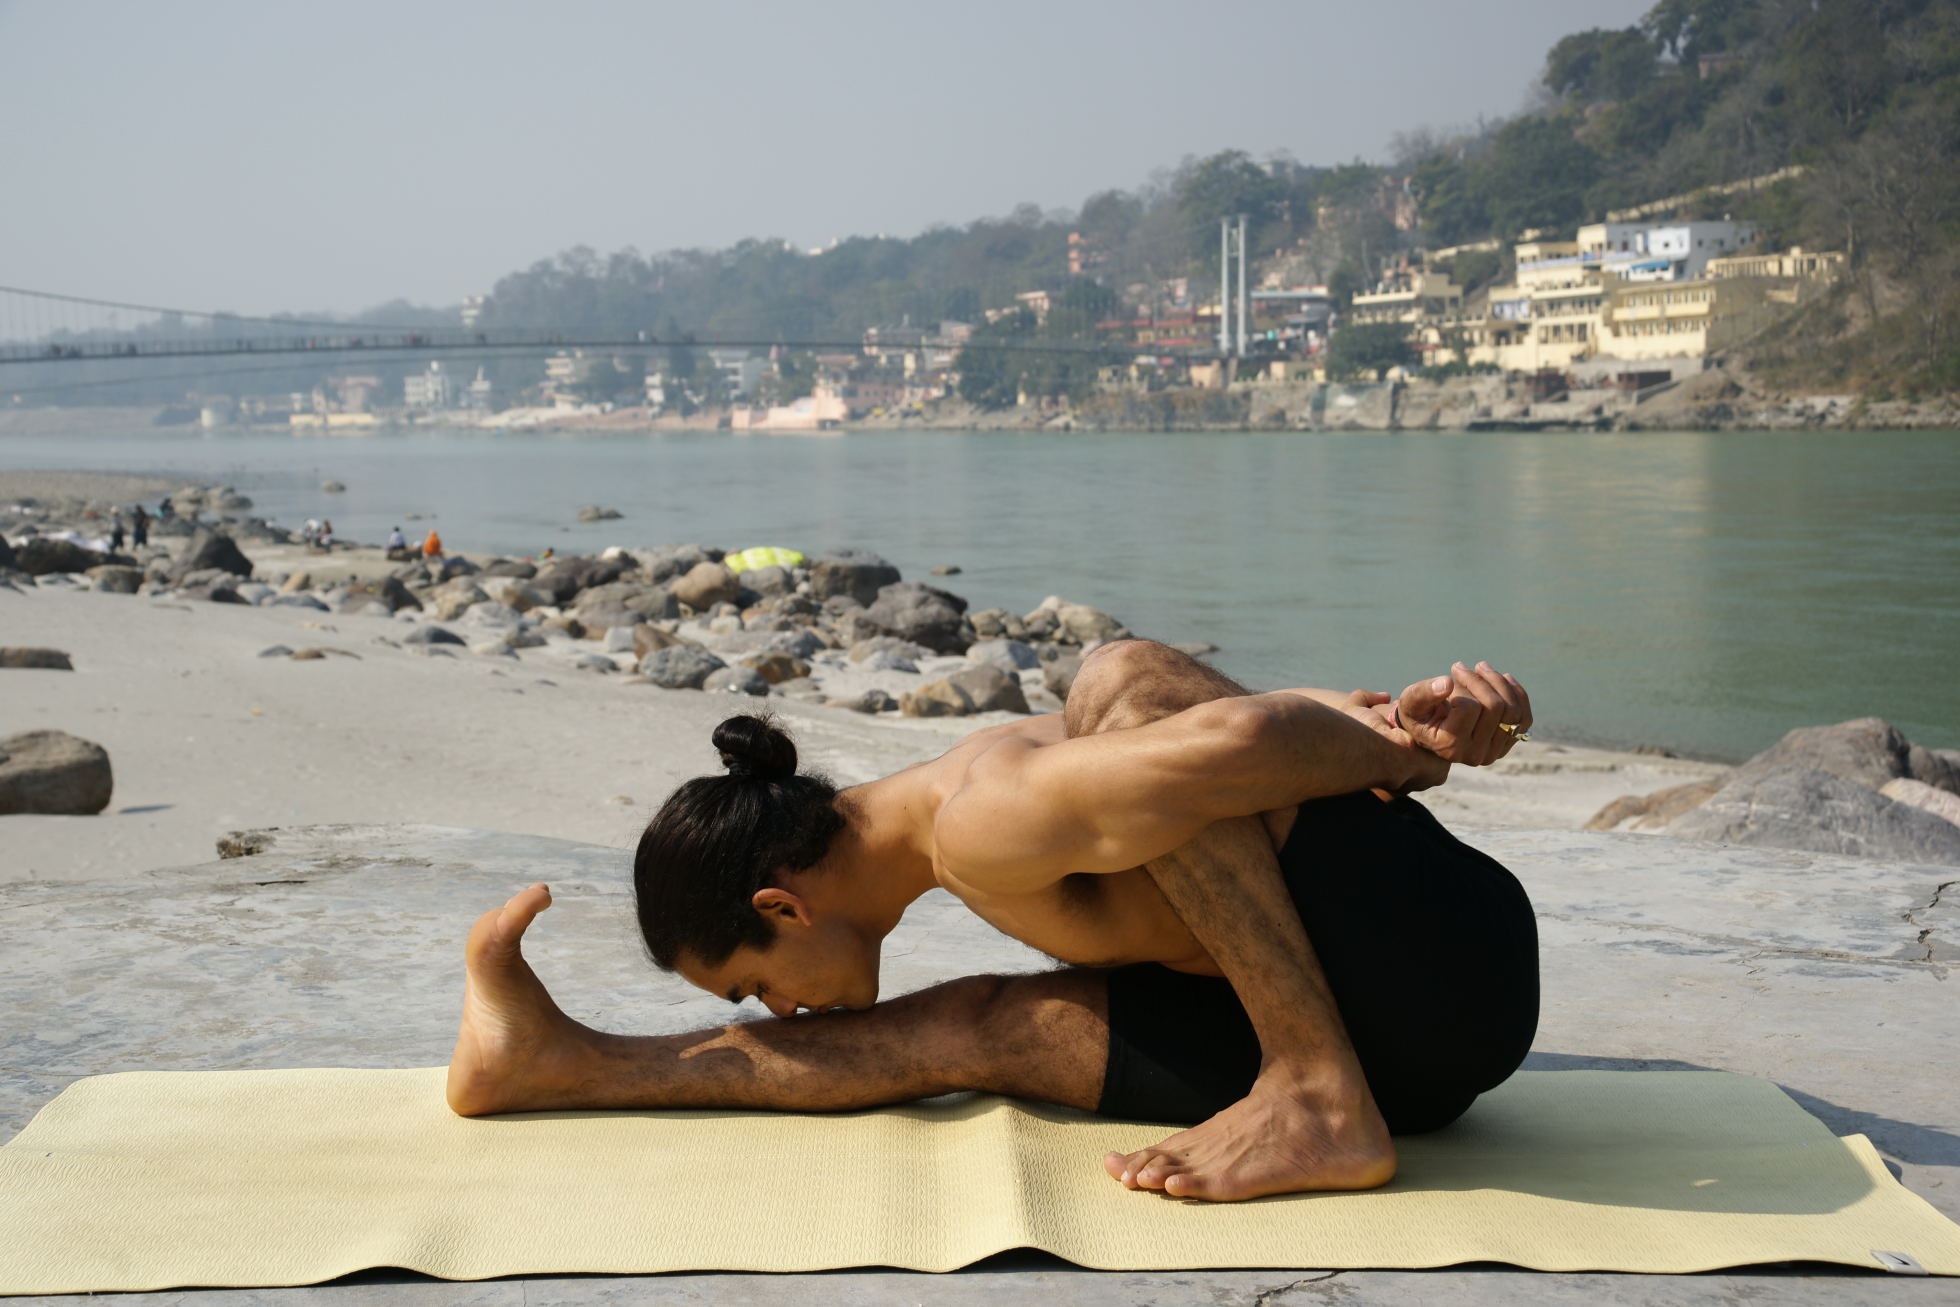
Yoga
I practice several types of yoga. Ashtanga is dynamic and active. Restorative and yin yoga are slower, quieter, and more passive physical practices.
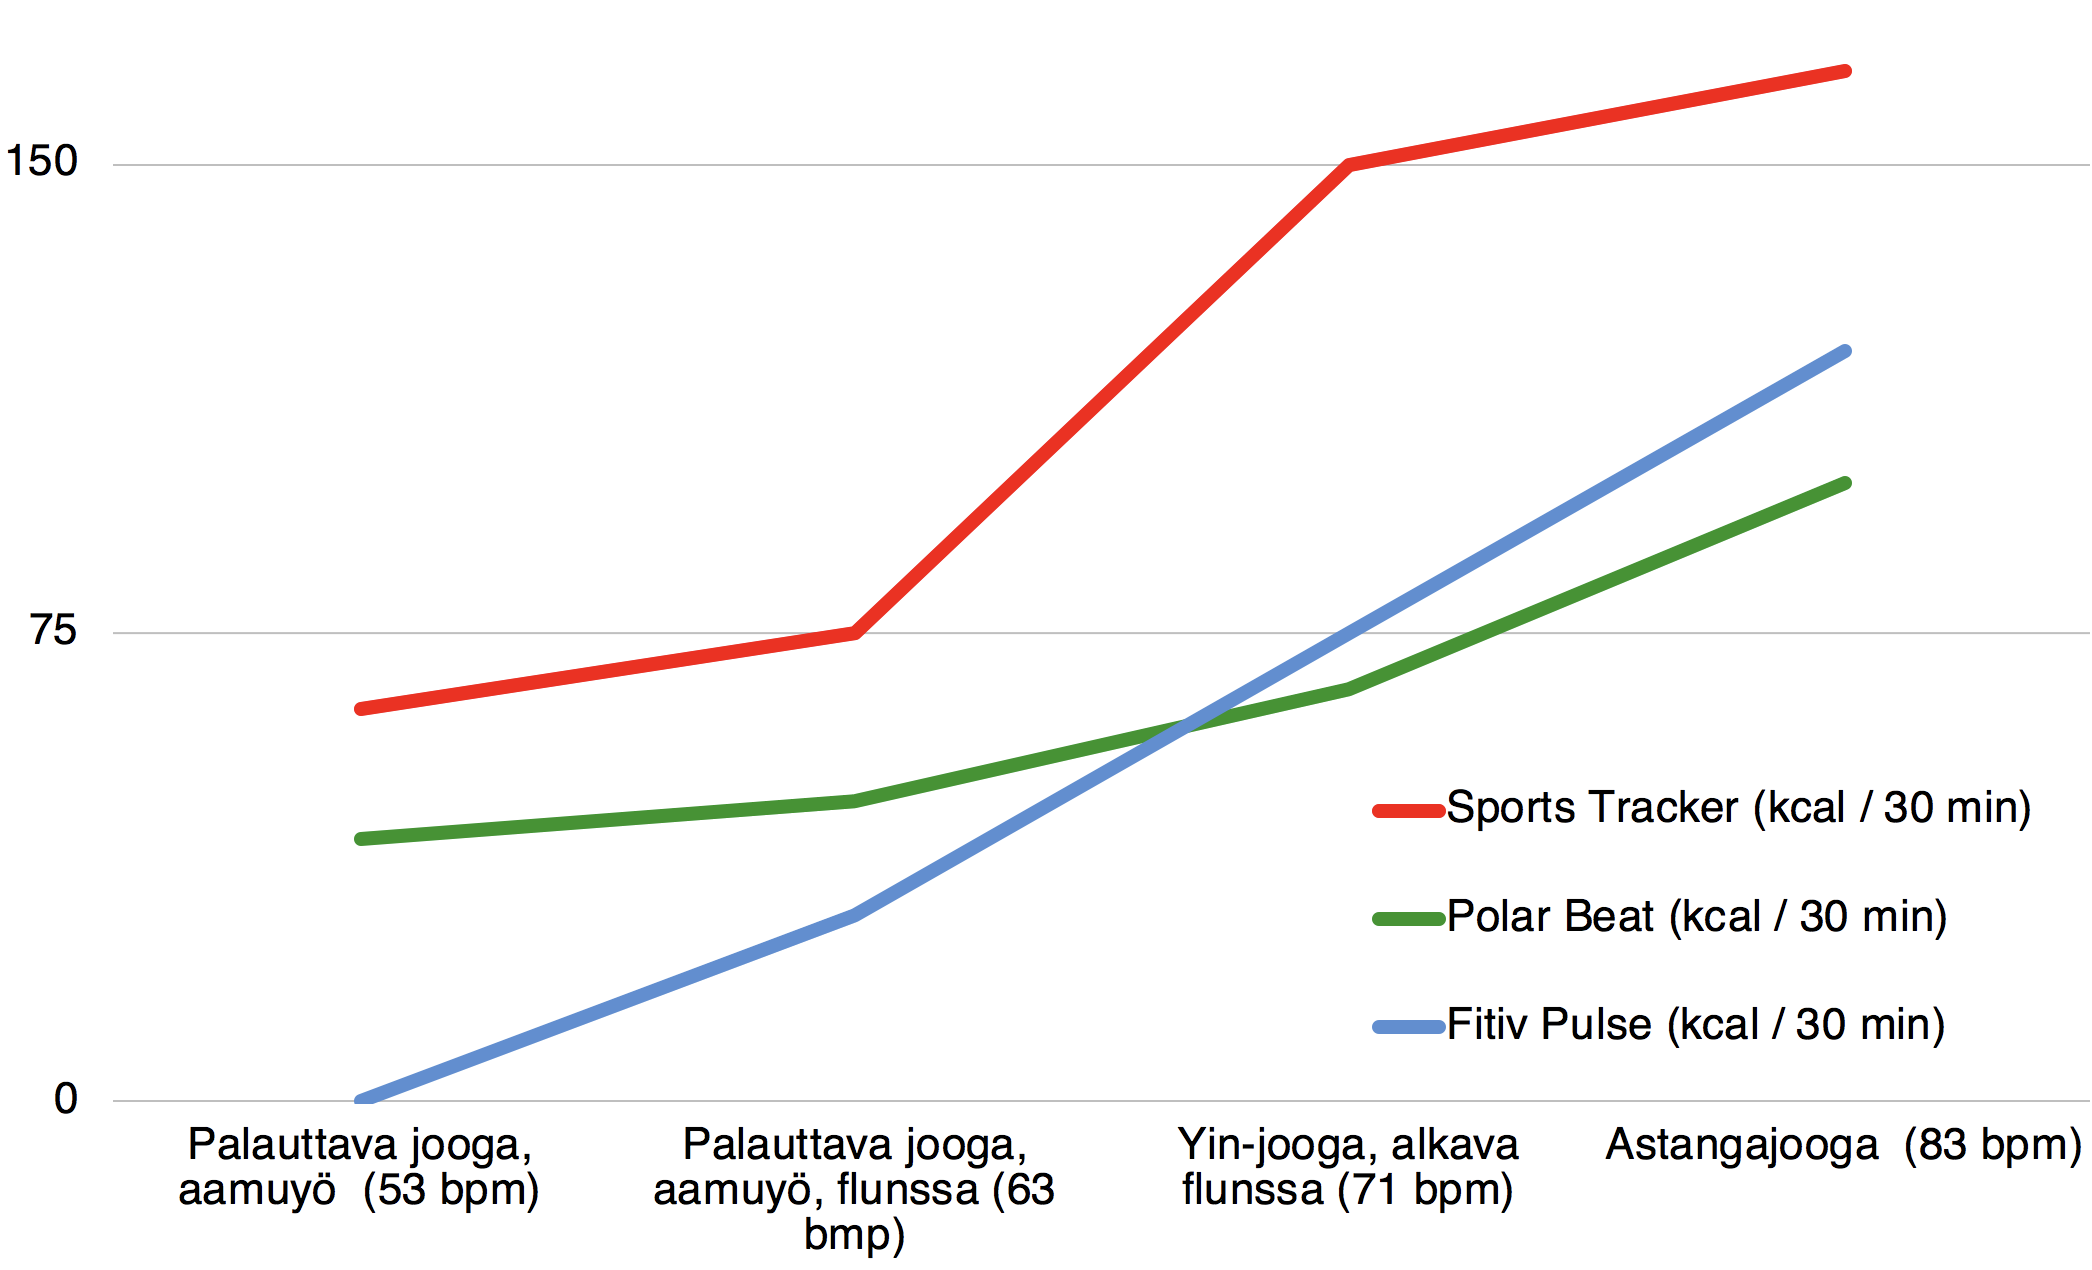
In Ashtanga, my average heart rate was surprisingly low—only 83 bpm. That was the average during the active phase. The total energy burn was also lower than I expected.
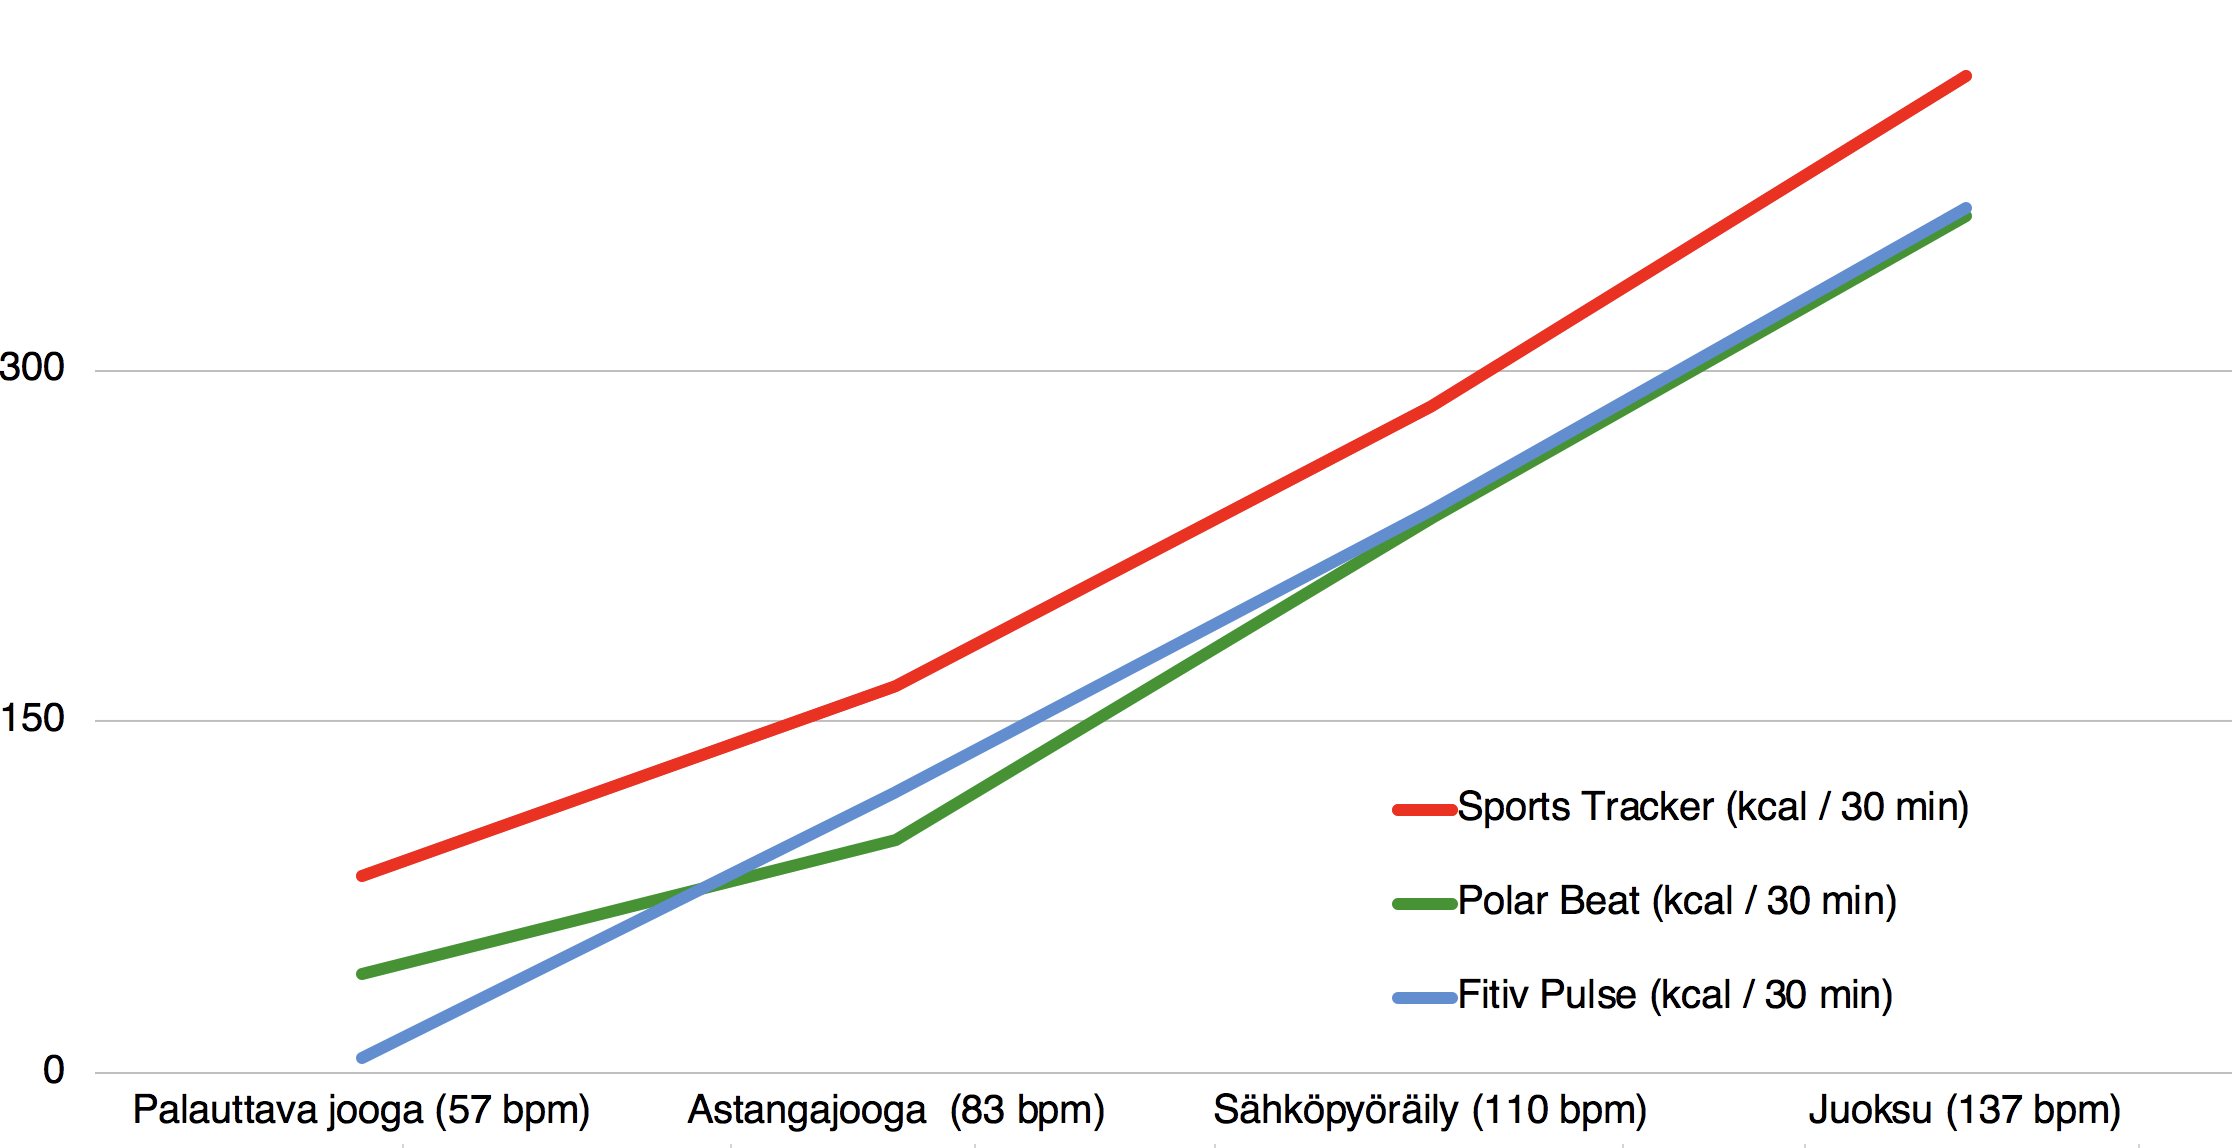
According to Polar Beat, Ashtanga yoga burned only 50 kcal per 30 minutes more than lying on my back. That seems hard to believe, since 50 kcal per 30 minutes is roughly what you burn while sitting. Sports Tracker and Fitiv Pulse show a bigger difference between active and passive yoga. According to them, Ashtanga burns more than 100 kcal per 30 minutes more than restorative yoga.
In restorative and yin yoga, my heart rate barely rose. Stress, a cold, or the time of day had a bigger effect on my pulse than the practice itself. I don’t think passive yoga burns much active energy. It might even lower it slightly, because my resting heart rate was sometimes lower after the session than before it.
| Sport | Energy use (kcal / 0.5 h) |
|---|---|
| Restorative and yin yoga | 0–5 |
| Ashtanga yoga | 100–120 |
Perceived effort in Ashtanga yoga
It’s striking how little my heart rate rose and how little energy I burned during Ashtanga. Yet I often feel tired afterward. The fatigue may come from deep support muscles that get worked hard in the practice. These muscles aren’t the largest in the body, but they’re in use all the time—even right after yoga, during everyday tasks.
A 2016 dissertation compared active yoga (vinyasa yoga) to walking. It also found that perceived effort was higher in active yoga than in brisk walking. The perceived effort during yoga was moderate (RPE 14).
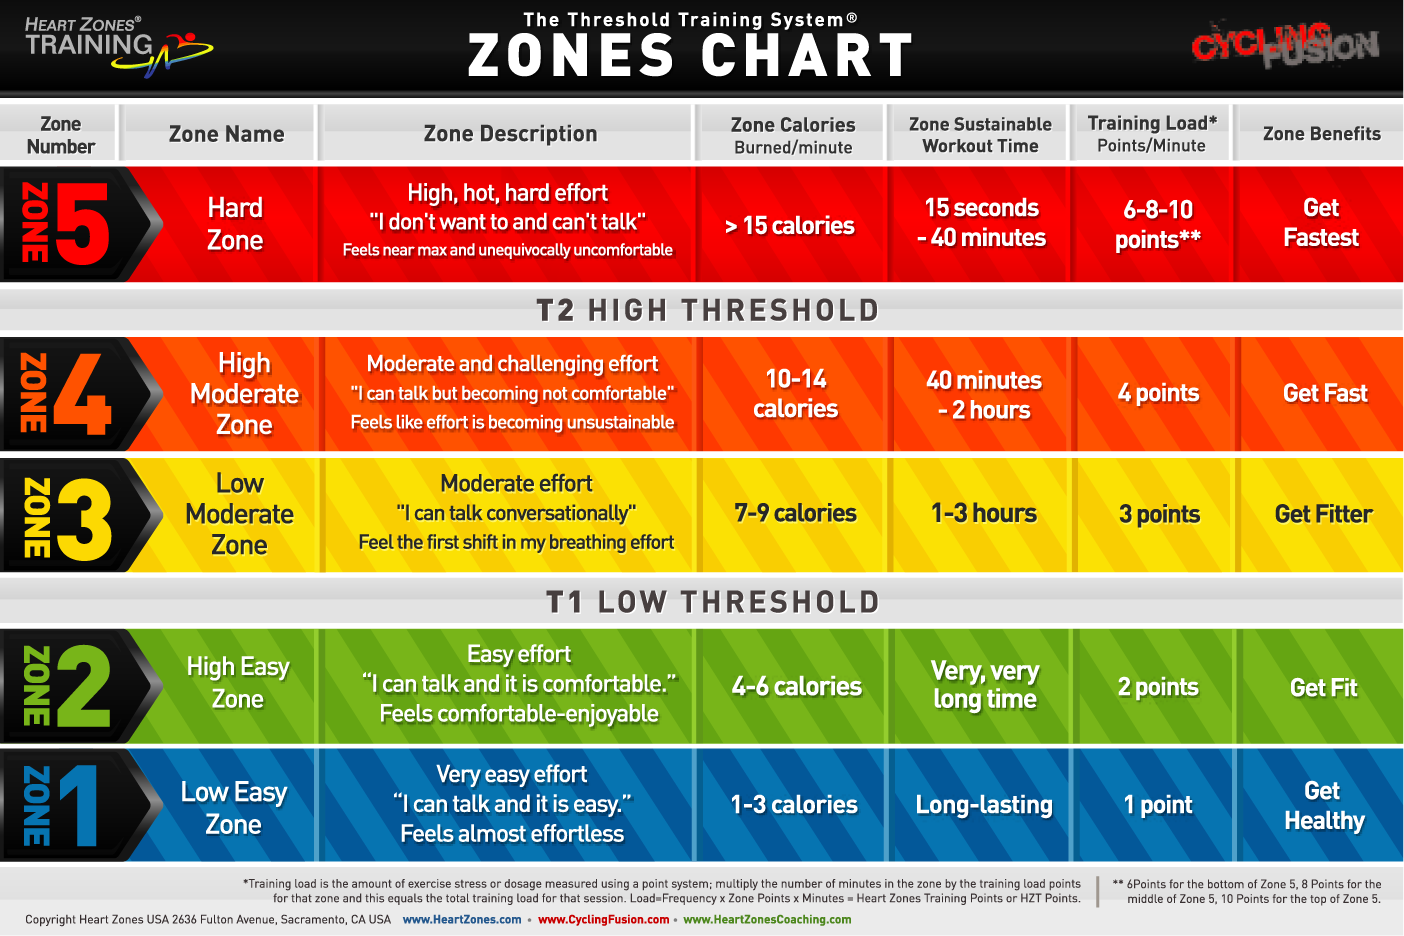
Static heart-rate zones
According to Polar Beat, out of the active 70 minutes of my Ashtanga practice, 18 seconds counted as light exercise, 22.5 minutes as very light exercise, and the rest wasn’t considered exercise at all. This was confusing and didn’t match how the session felt.
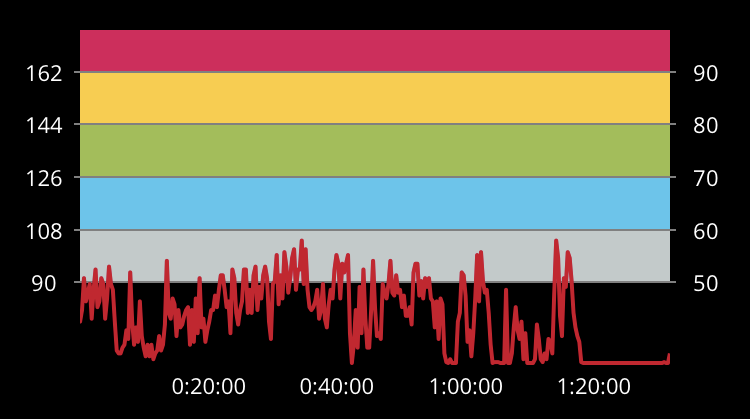
If I bumped the Polar Beat heart-rate curve (image above) up by two zones, it would line up better with how Ashtanga actually feels. With that shift, about two-thirds of the session would be light, one-third moderate, and about 0.5% heavy exercise. That already sounds much more like an active yoga practice.
I use a heart rate reserve model (HRR) in my own calorie calculator to estimate energy use. Polar Beat and Sports Tracker, on the other hand, rely on heart rate zones. HRR handles low-intensity activity better than zone-based systems. In the HRR model, even a small rise in heart rate already burns some energy. In the zone model, your heart rate has to climb quite a bit before the app counts it as exercise.
For example, if someone has a resting heart rate of 45 bpm and a max of 180 bpm, the lowest third of their heart rate reserve (45–90 bpm) sits below the zone thresholds. Yet long-lasting light activity at low heart rates still burns a lot of energy and fat.
Ashtanga yoga as strength training
According to the UK National Health Service, weekly strength training sessions can be replaced with yoga. Studies on Bikram yoga show increases in flexibility and strength, but not in aerobic fitness. Ashtanga yoga also seems to work as a form of strength training.
Session lengths in Ashtanga
The muscles work fairly hard in Ashtanga. This shows in how long a session typically lasts.
Two hours is a common upper limit for moderate-intensity exercise (see chart below). An Ashtanga session usually tops out at about an hour and a half.
More demanding Ashtanga poses work the small muscles of the body much like strength training. You hold each asana for about half a minute. During that time, the muscles doing the hardest work often hit their limit. In efforts of that duration, the muscle relies mostly on alactic (ATP-CP) and anaerobic (glycolytic) energy systems (see chart). These pathways are typical in strength training.
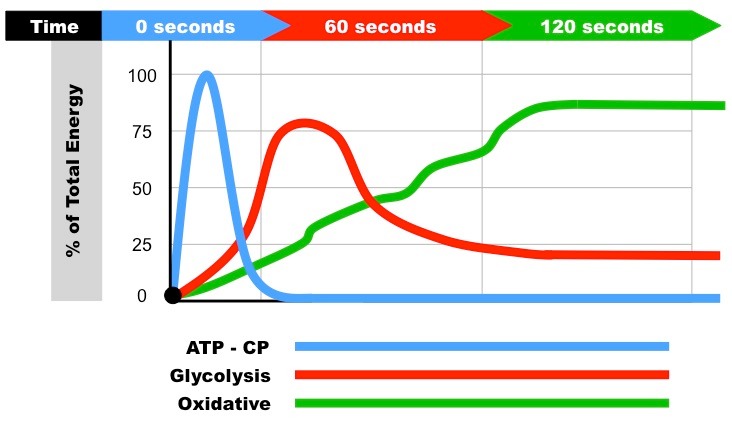
Ashtanga moves from one asana to the next with the rhythm of the breath. During that transition, the alactic stores mostly recover.
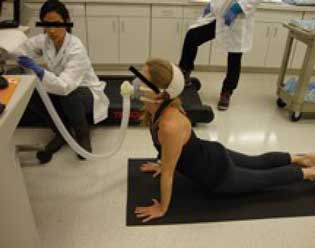
Oxygen use in Ashtanga yoga
I compared my own heart-rate–based calorie calculator with results from dissertation on yoga. The calculator predicts walking energy use fairly consistently, even though its numbers differ from the values measured in the study (see chart). The study used a metabolic mask, which measures total oxygen use. My calculator estimates active energy, so the results should diverge.
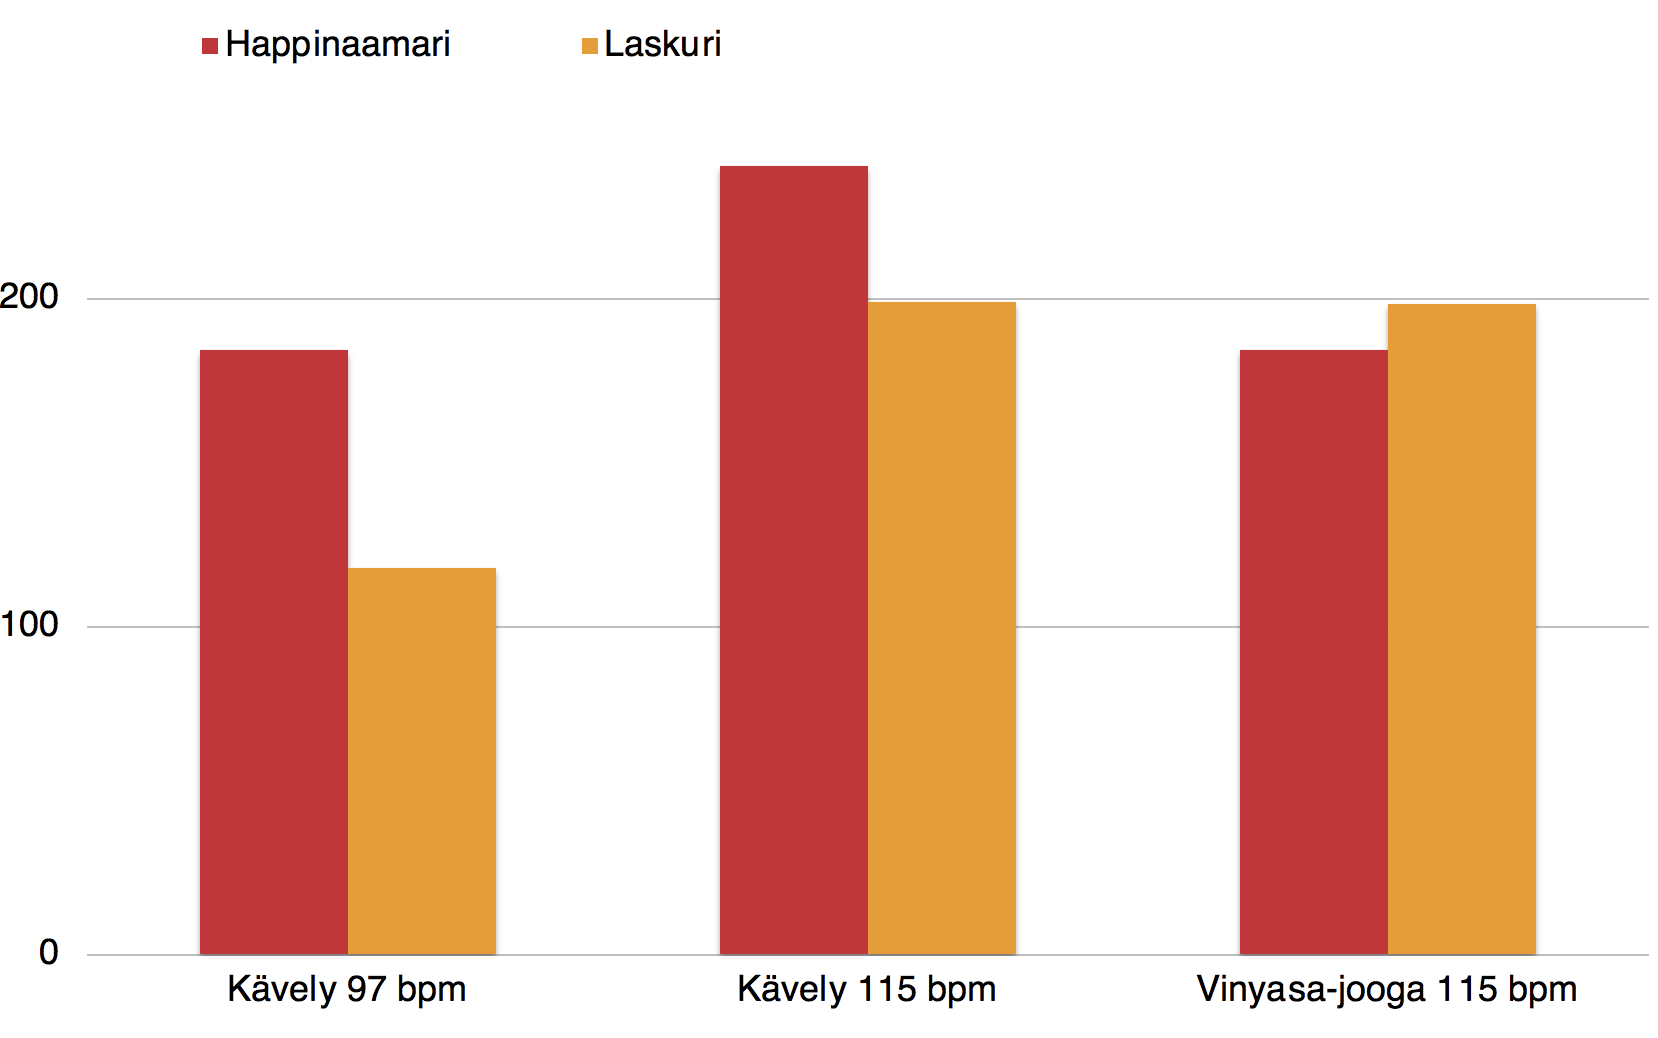
In the study, men’s oxygen use during yoga was surprisingly low for the heart rates they reached. You’d expect oxygen use to rise steadily with heart rate. But at the same 115 bpm, Ashtanga burned 30% less energy than walking did in the study (red bars in the chart).
Why oxygen use stays low
Active Ashtanga sessions raised my heart rate less than I expected. There are many reasons for this.
Yoga, including Ashtanga, involves many eccentric movements. In eccentric work, the muscle lengthens while producing force. Eccentric contractions consume less oxygen than concentric ones, where the muscle shortens while working.
Ashtanga also uses less oxygen than walking because the muscle tension lasts longer at a time. If a muscle stays active for, say, three seconds at once, it burns less than three separate one-second contractions.
App behavior
In Polar Beat, the energy use for different yoga styles varied surprisingly little. When the heart rate was 45–50% of max (around 83 bpm), the energy estimate dipped.
Fitiv Pulse reports active energy. This is usually about 60 kcal per 30 minutes lower than the number shown by Sports Tracker. Sports Tracker appears to show total energy use.
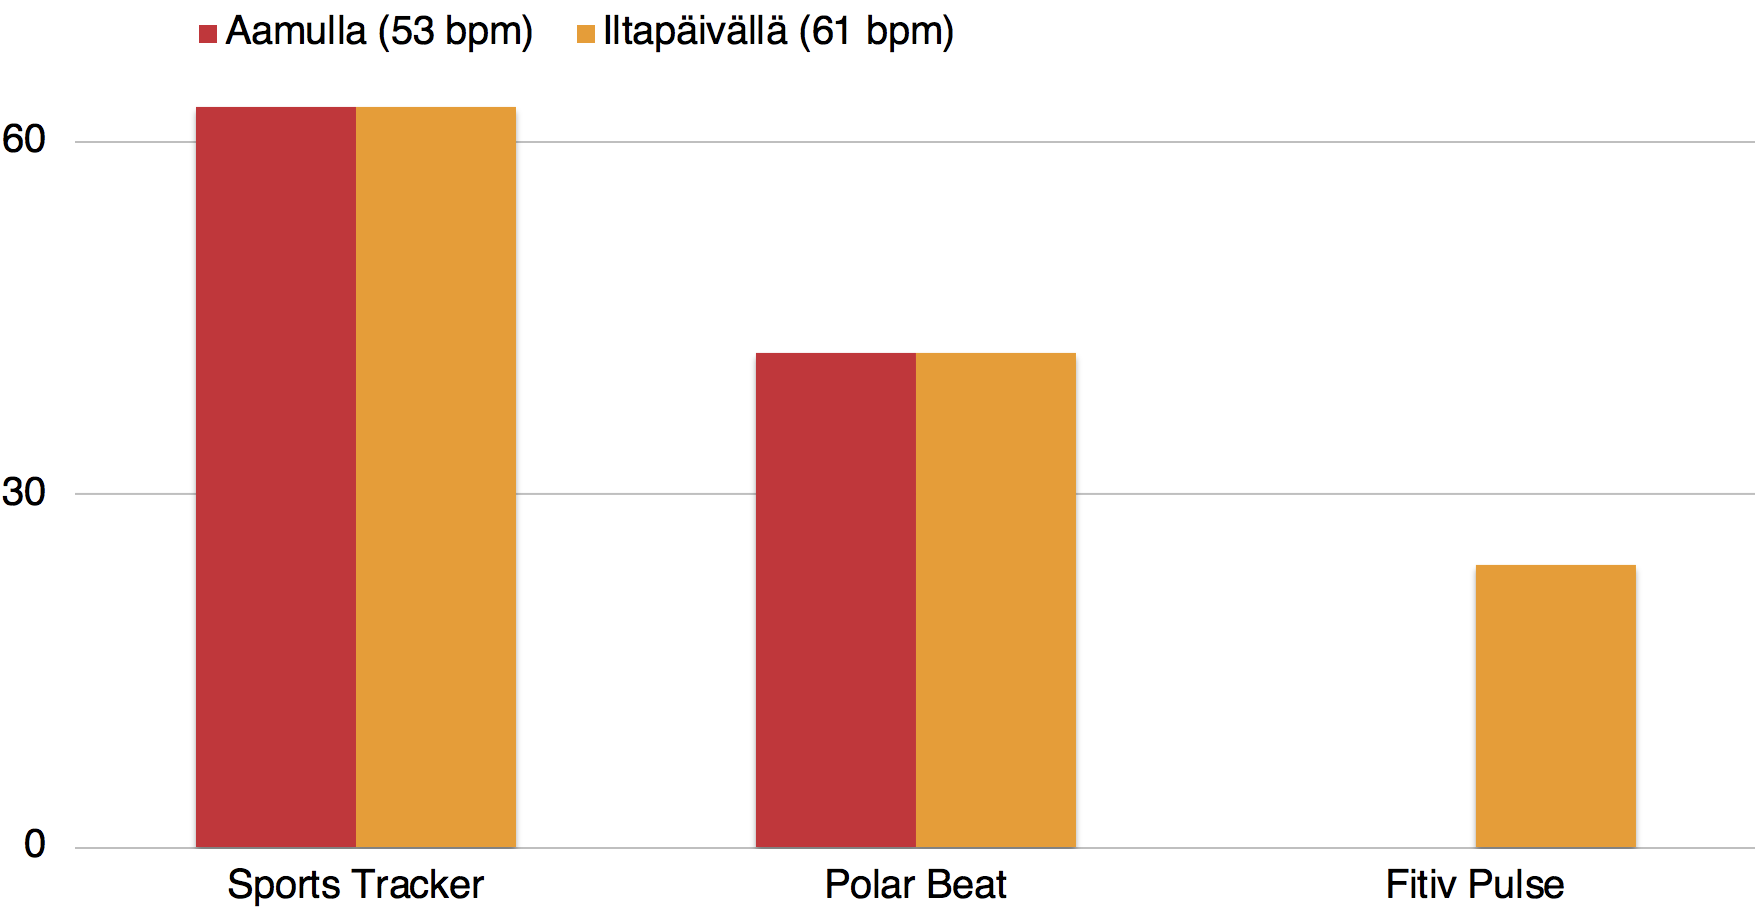
Fitiv Pulse reports zero calories at rest (see chart). Because resting heart rate varies through the day, I burned 24 kcal per 30 minutes lying down in the afternoon according to Fitiv Pulse. Polar Beat shows about 40 kcal per 30 minutes at rest.
Fitiv Pulse includes resting heart rate in the user profile, and the app appears to use it. The other apps don’t ask for resting HR.
Keeping an exercise diary is easiest with Fitiv Pulse because it reports active energy directly. If you log total calories but don’t log the calories burned while sitting, you end up with too many calories in your diary.
Autopause
Autopause helps measure the duration of active exercise more accurately. This feature works best in Sports Tracker, and mostly works in Fitiv Pulse. In winter, I can’t start moving right after starting the app because I have to put on gloves. I also stop often to help my child or run errands.
In Sports Tracker and Strava, autopause is placed right on the workout start screen. It’s especially easy to spot in Sports Tracker (image above).
My activities
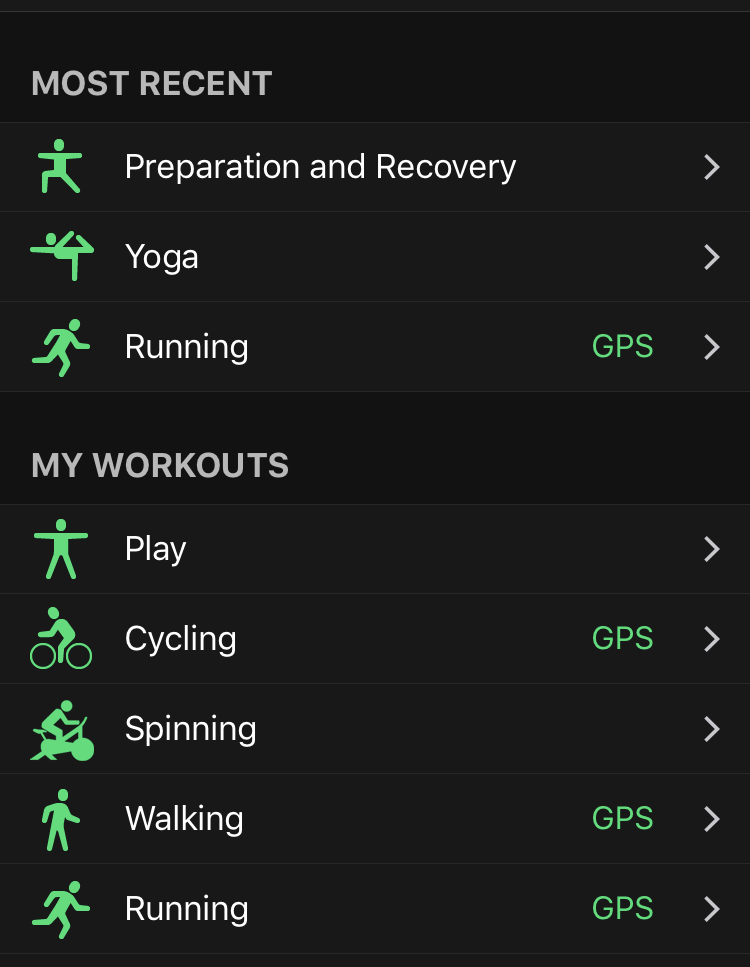
I repeatedly track 5–10 types of exercise. Fitiv Pulse lets you select favorite activities and remembers your most recent ones (see image).
Sports Tracker also shows the most recent activities at the top. It shows three items, which was enough in practice even though I logged several types.
Polar Beat offers no favorites or recent items, so I had to use the search each time I logged something. The search was awkward. For example, “spinning” didn’t appear when searching for “cycling,” and I didn’t always remember Polar Beat’s exact terminology.
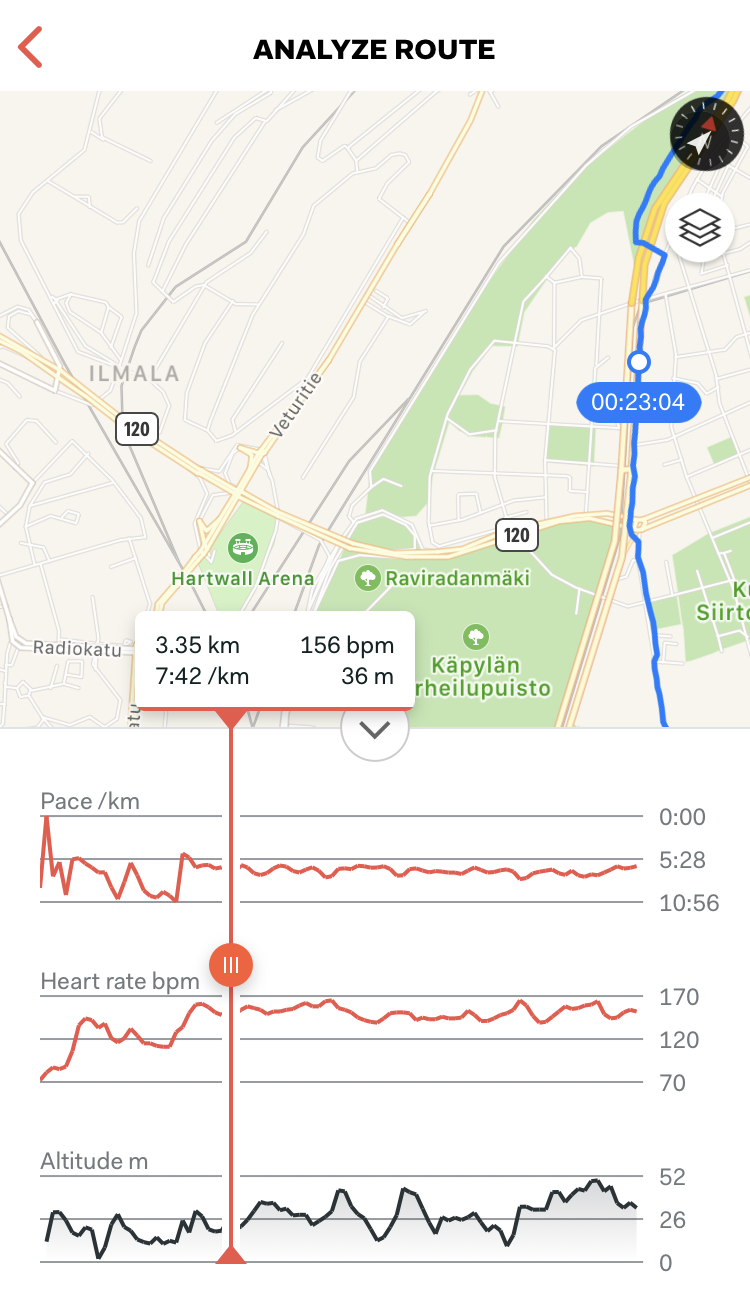
Heart rate and speed on the map
My heart-rate calorie calculator
I built a heart-rate–based calorie calculator because readers often want their own numbers. Once you know your resting heart rate and your heart rate during exercise, the numbers are easy to estimate.
Small differences in age and in resting and max heart rate noticeably affect the results. The calculator helped me see this clearly.
The best apps
Sports Tracker and Fitiv Pulse were the most practical of the apps I tested for estimating energy use during e-biking and yoga. I now use Sports Tracker myself because it’s free. I didn’t like Fitiv Pulse since it activated an iTunes subscription almost without warning.
When I log new types of activities, I often calculate the calories with my own HR calculator. Once I learn the typical energy use for an activity, I use calorie tables. The logging app I use (Yazio) fills in the calorie tables automatically for my weight.